Blog
Opinion and analysis on how public companies generate revenue, with interactive Sankey diagrams in every post.
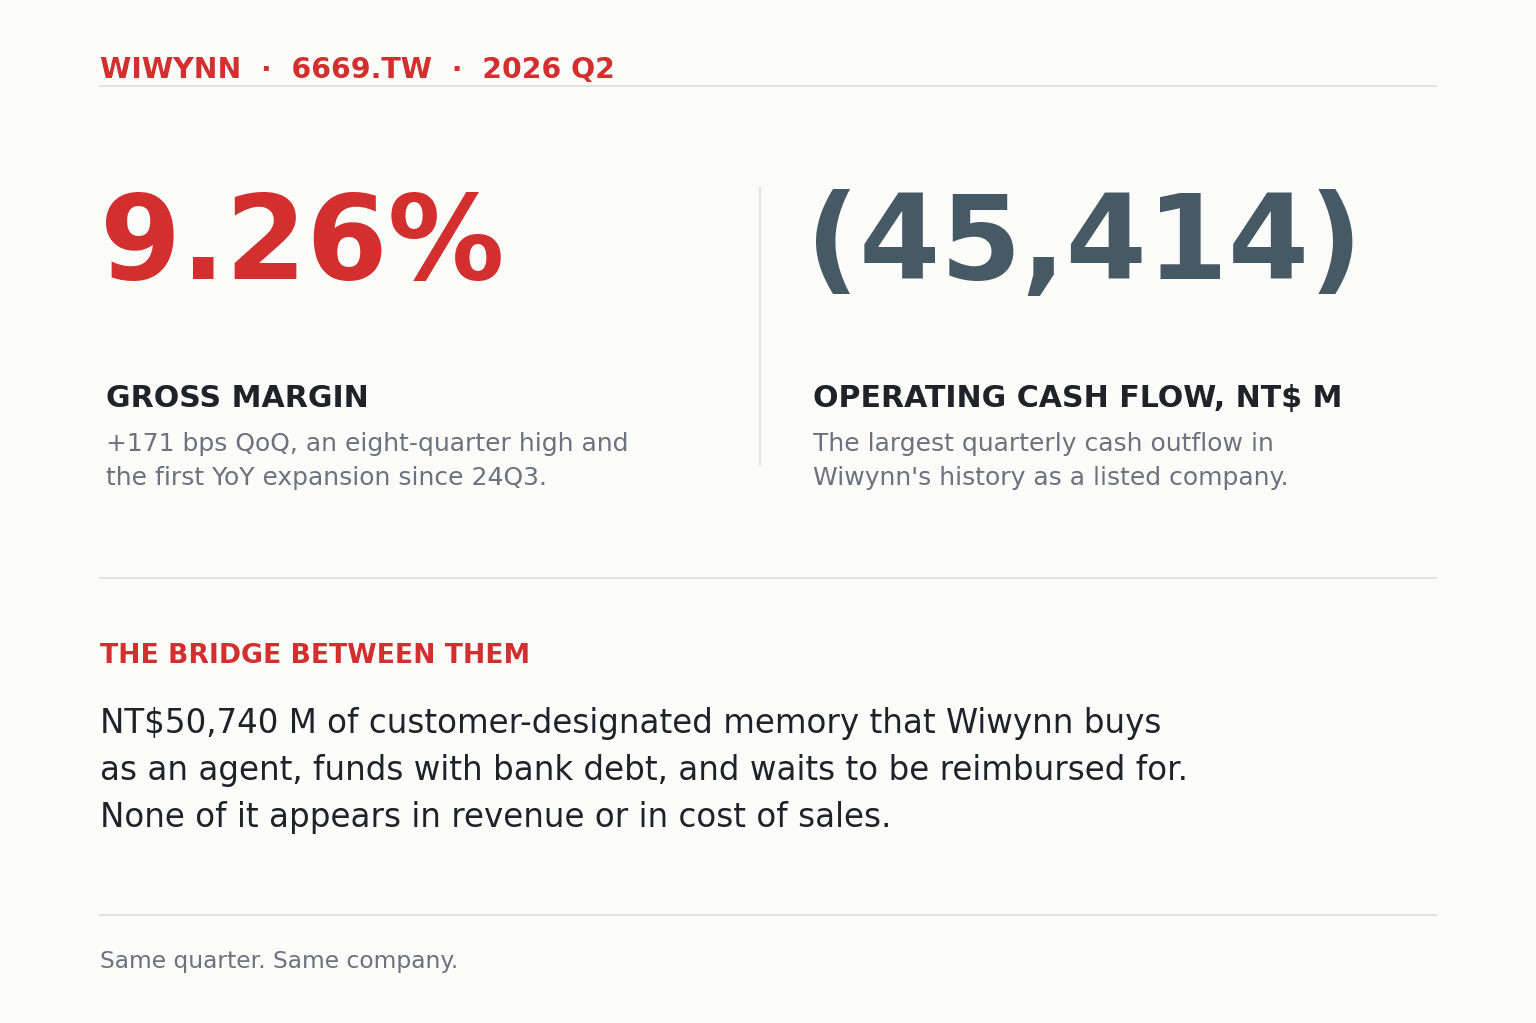
Wiwynn Q2 2026: Best Margin Ever, Worst Cash Flow Ever
Wiwynn (6669.TW) posted a 9.26% gross margin in Q2 2026, its best in eight quarters, and minus NT$45.41 billion of operating cash flow, its worst ever.
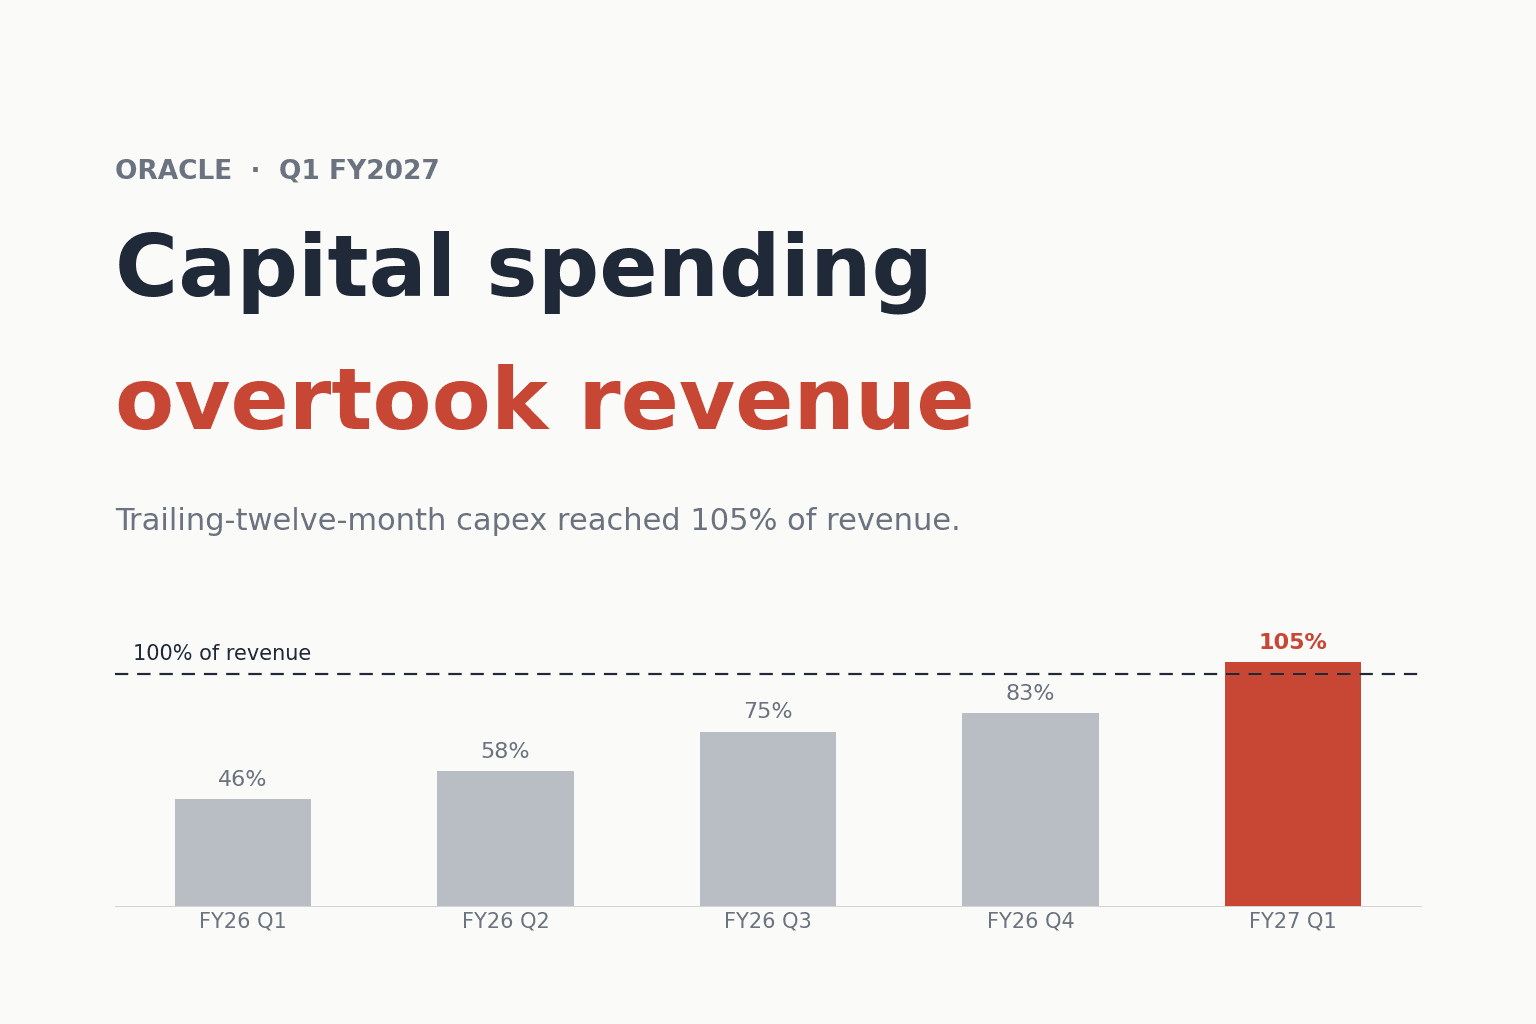
Oracle Now Spends More on Capex Than It Earns in Sales
Oracle's revenue grew 30% and OCI 121%, but trailing capital spending hit 105% of revenue. The stock opened up 7.5% and closed down 1.7% on nearly 4x volume.
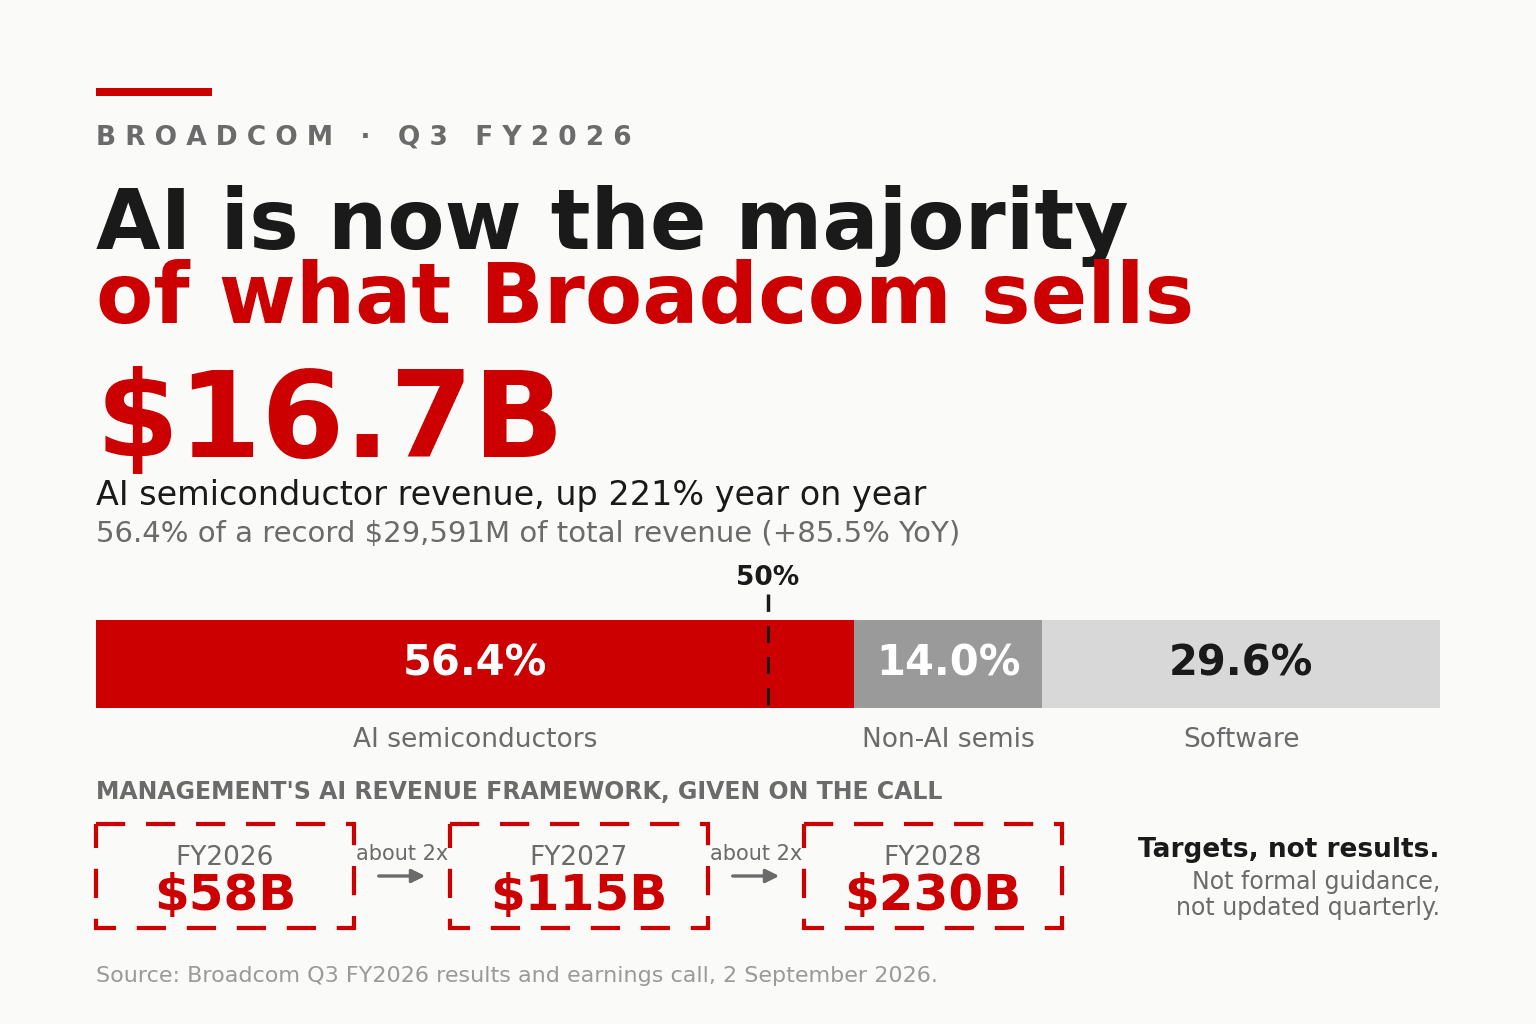
Broadcom Q3 FY26: AI is now most of what it sells
Broadcom AI chip revenue hit $16.7B, 56% of the company. Revenue rose 85.5% to $29.6B, management put FY2028 AI revenue near $230B, and the stock still fell.
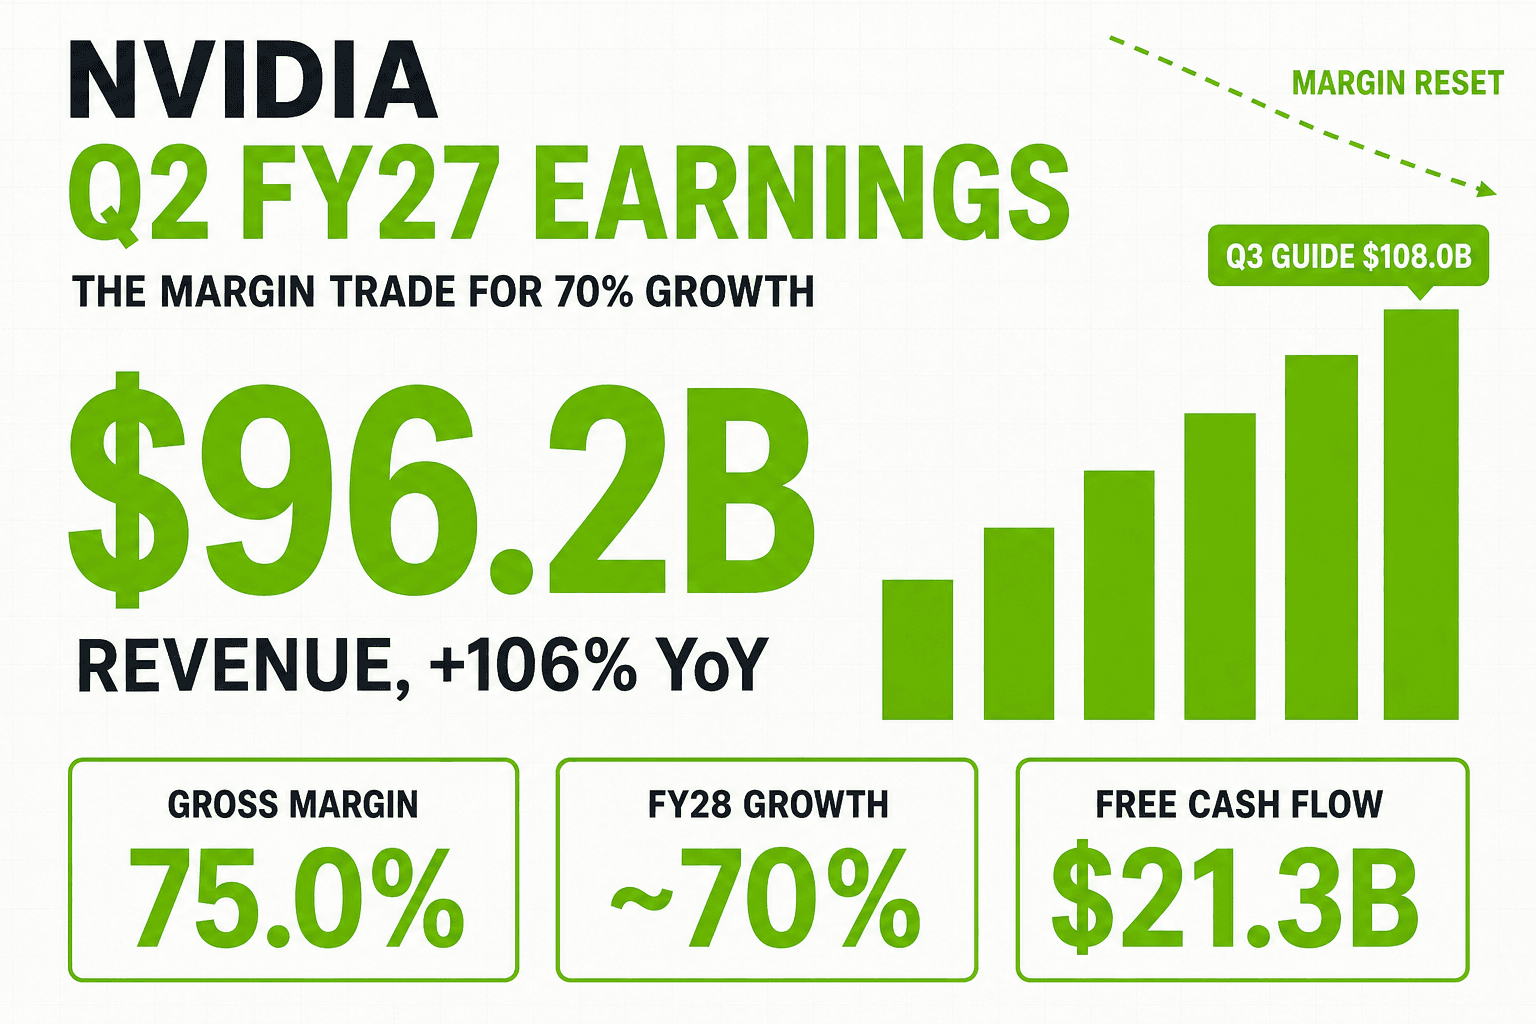
NVIDIA Q2 FY27: a margin reset to buy 70% growth
NVIDIA printed $96.2B revenue, up 106% YoY, and guided Q3 to $108B. Then it traded gross margin down toward 71% to buy an unprecedented 70% FY28 growth guide.
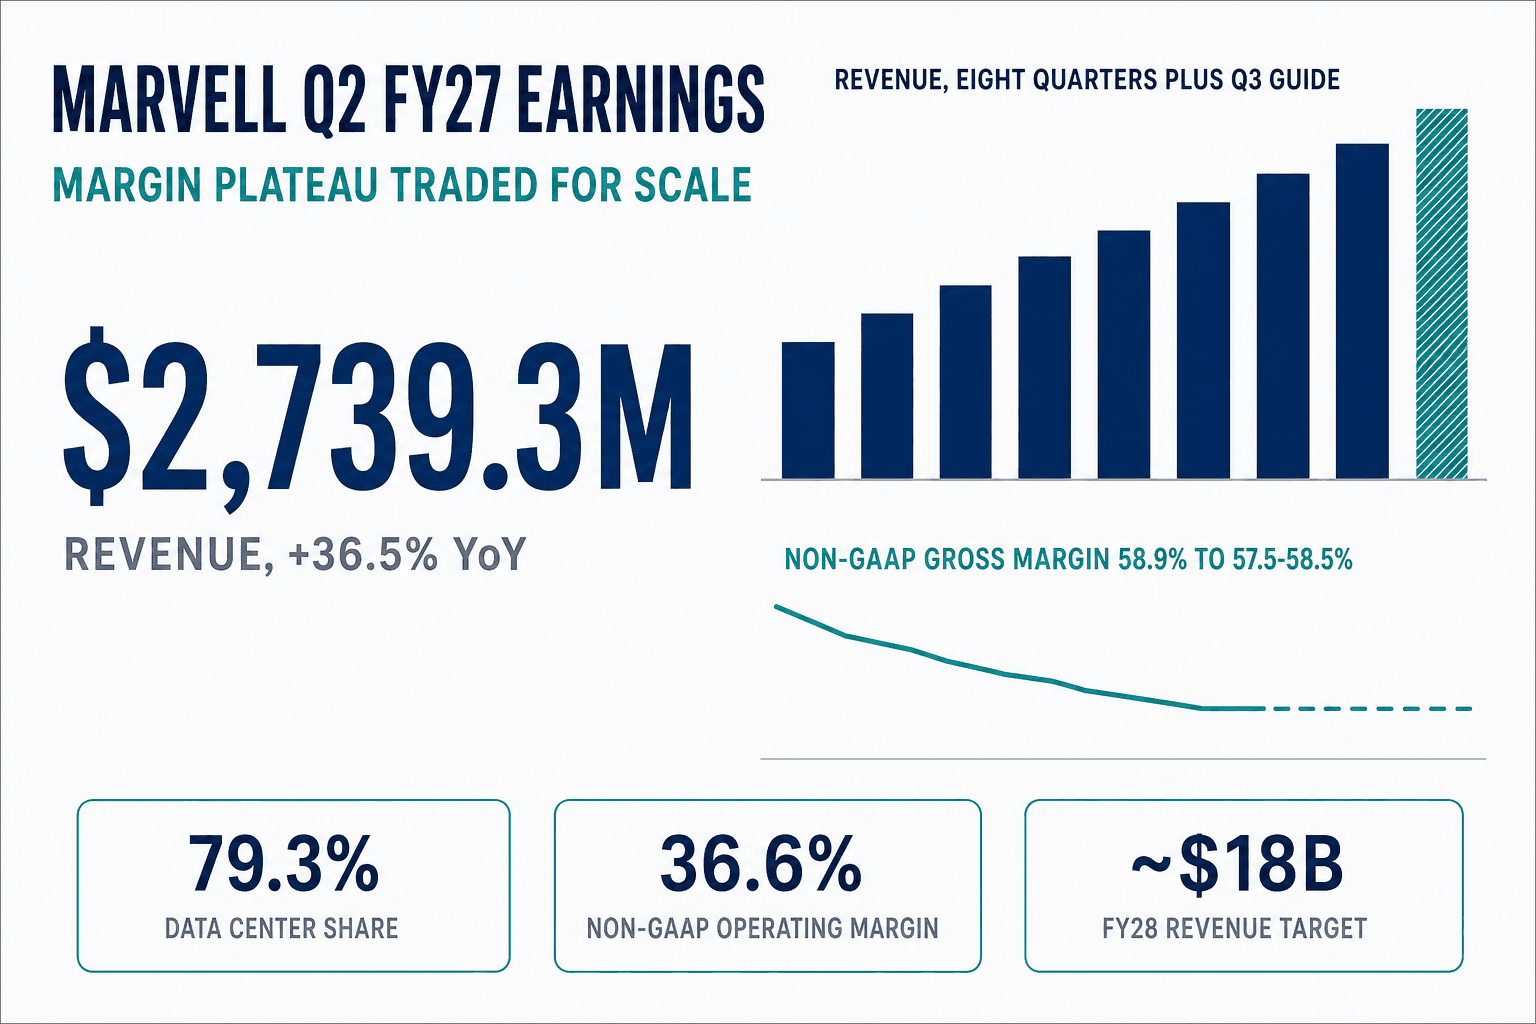
Marvell Q2 FY27: margin plateau traded for scale
Marvell printed a record $2.74B quarter and raised its FY28 target to $18B. Then its new CFO said gross margin stays at the lower range through fiscal 2028.
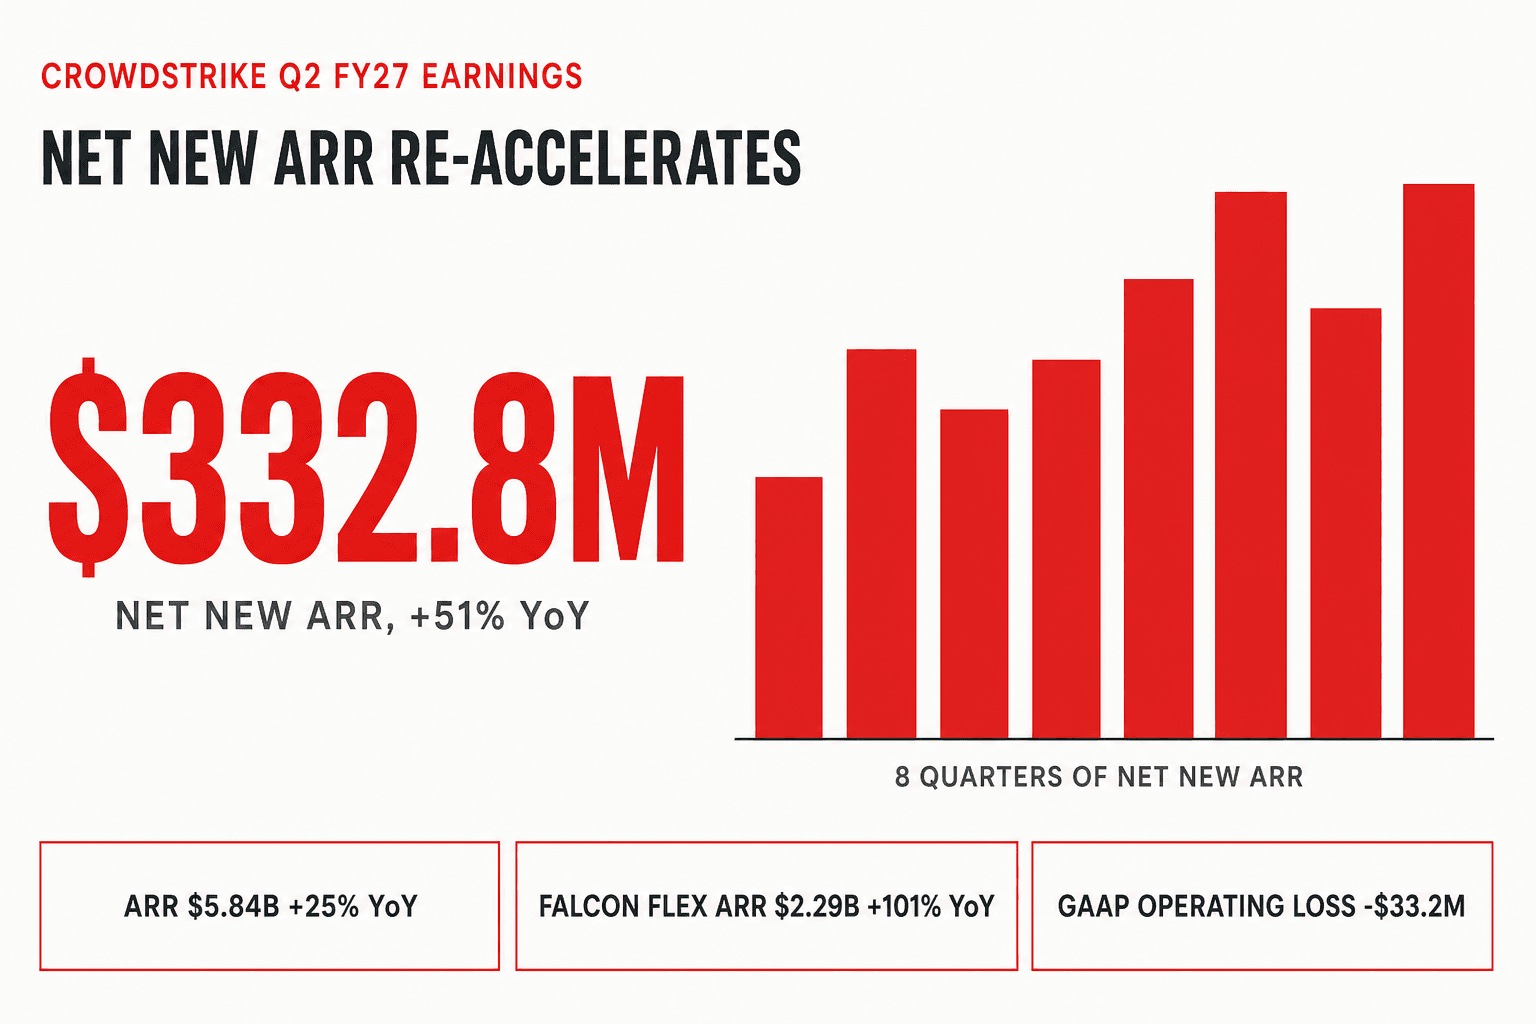
CrowdStrike Q2 FY27: net new ARR re-accelerates to 51%
CrowdStrike printed record net new ARR of $332.8M, up 51% YoY, and raised its full-year outlook by 630 basis points. GAAP operations still lost $33.2M.
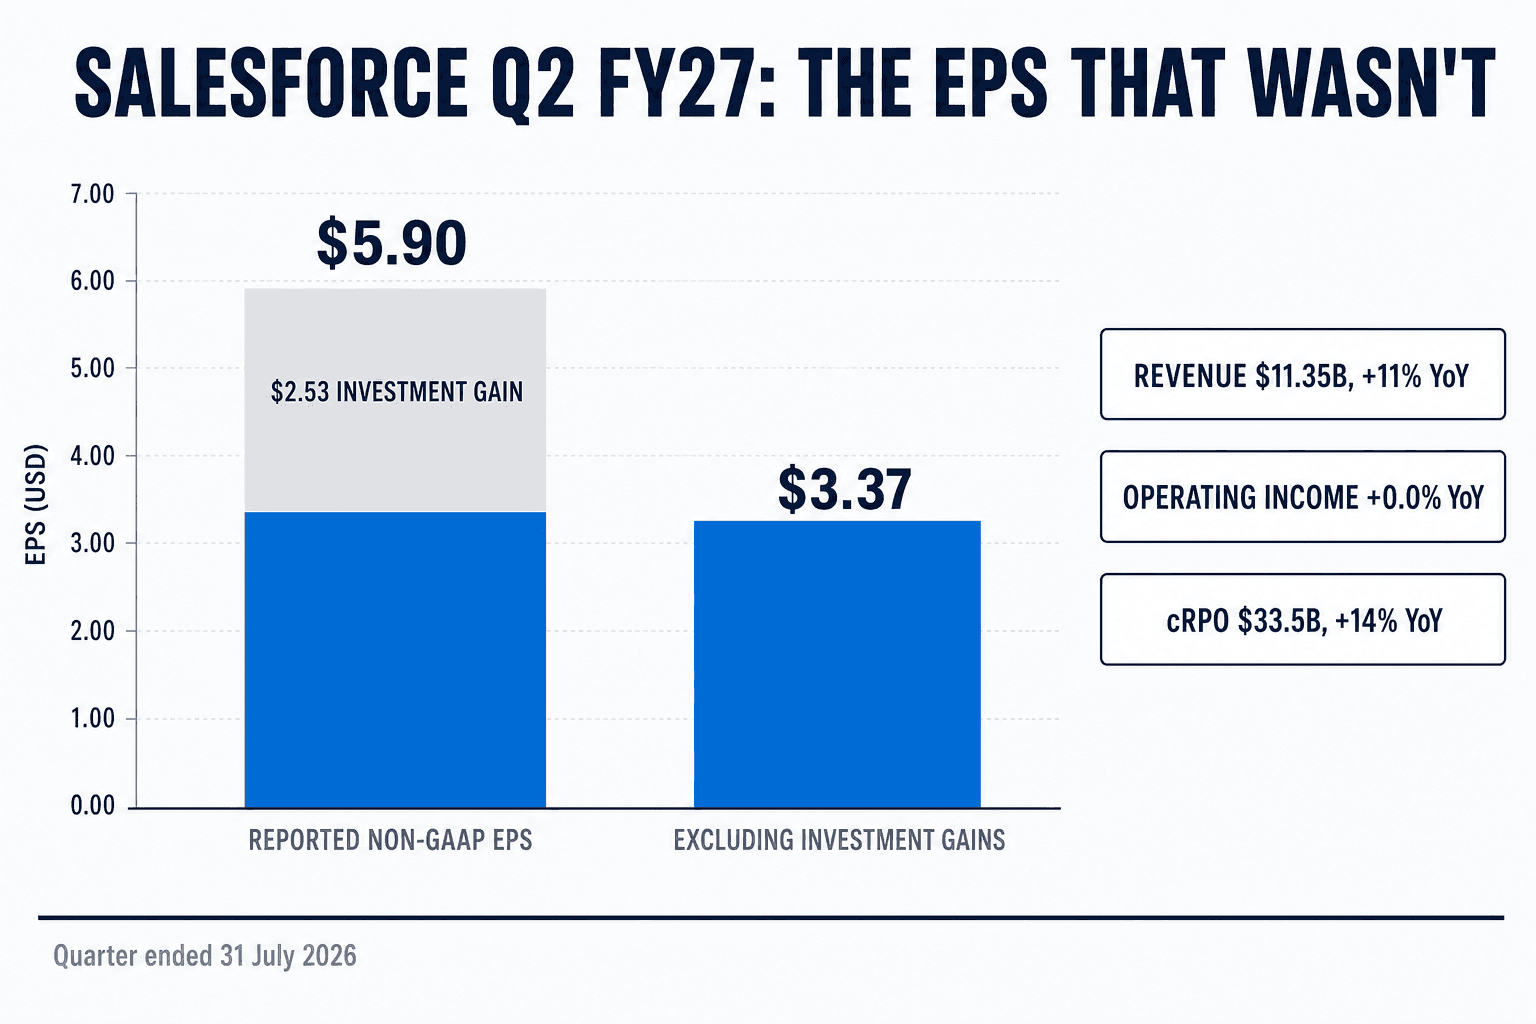
Salesforce Q2 FY27: EPS doubled, operations didn't
Salesforce non-GAAP EPS rose 103% to $5.90 and the stock jumped 22.6%. Strip out the investment gain the company itself discloses, and EPS grew 15.8%, not 103%.
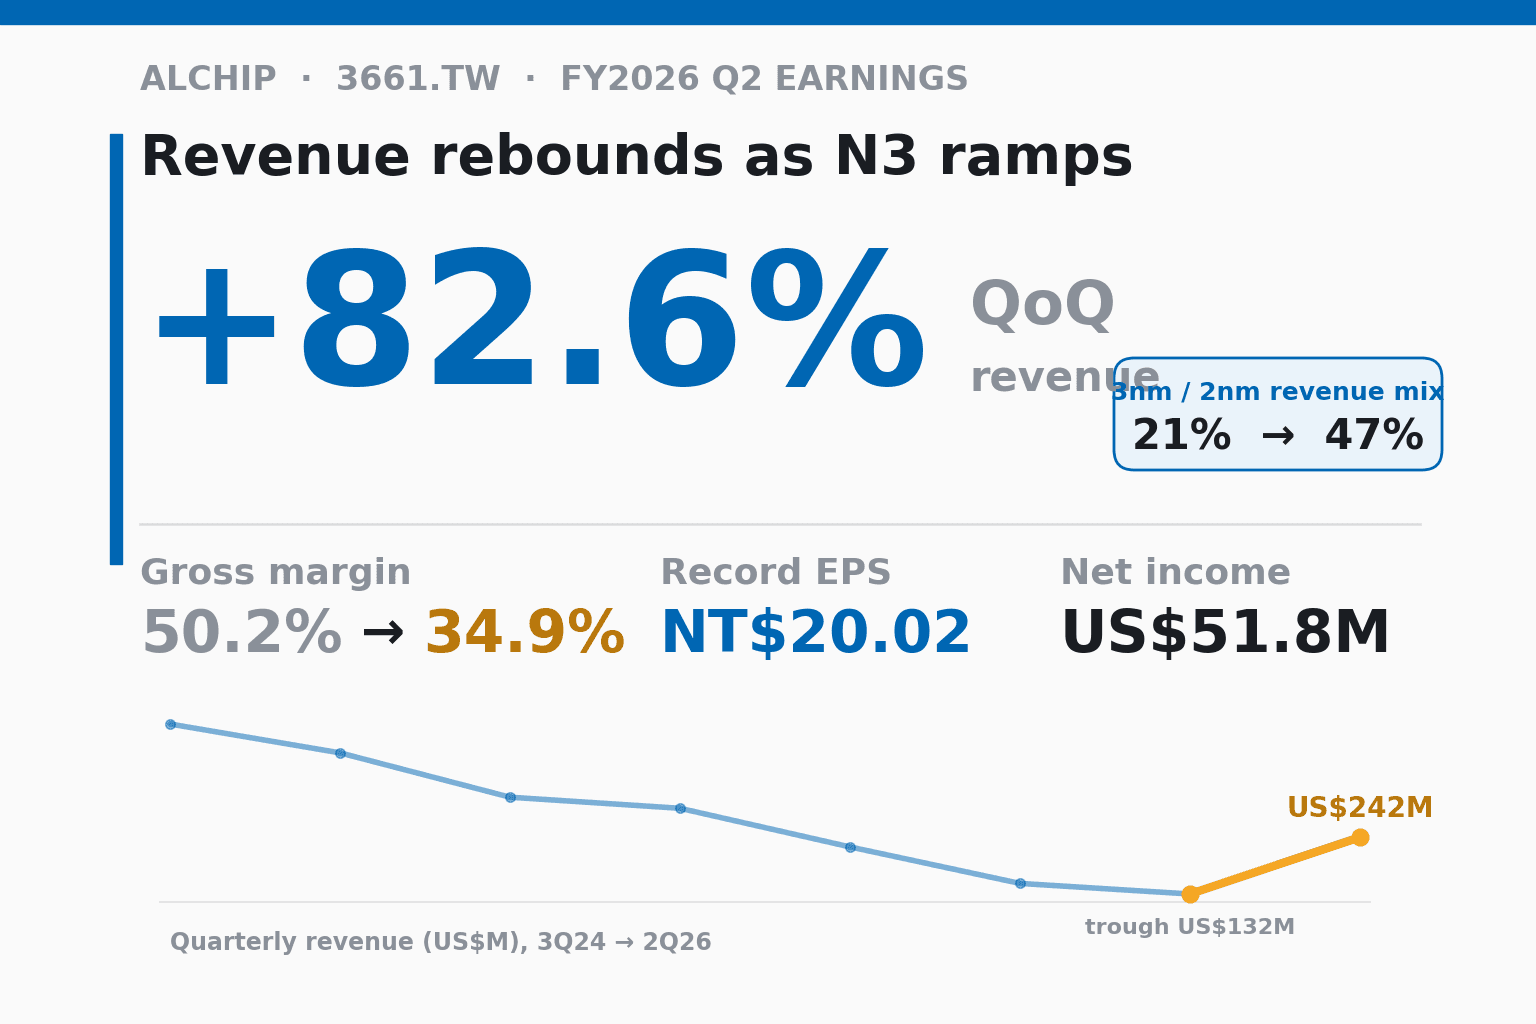
Alchip Q2 2026: N3 Ramp Lifts Revenue 82.6%, EPS Hits Record
Alchip (3661.TW) posted Q2 revenue of US$241.7M, up 82.6% QoQ, as N3 production lifted the 3nm/2nm mix to 47%. Margin fell to 34.9%, EPS hit a record NT$20.02.
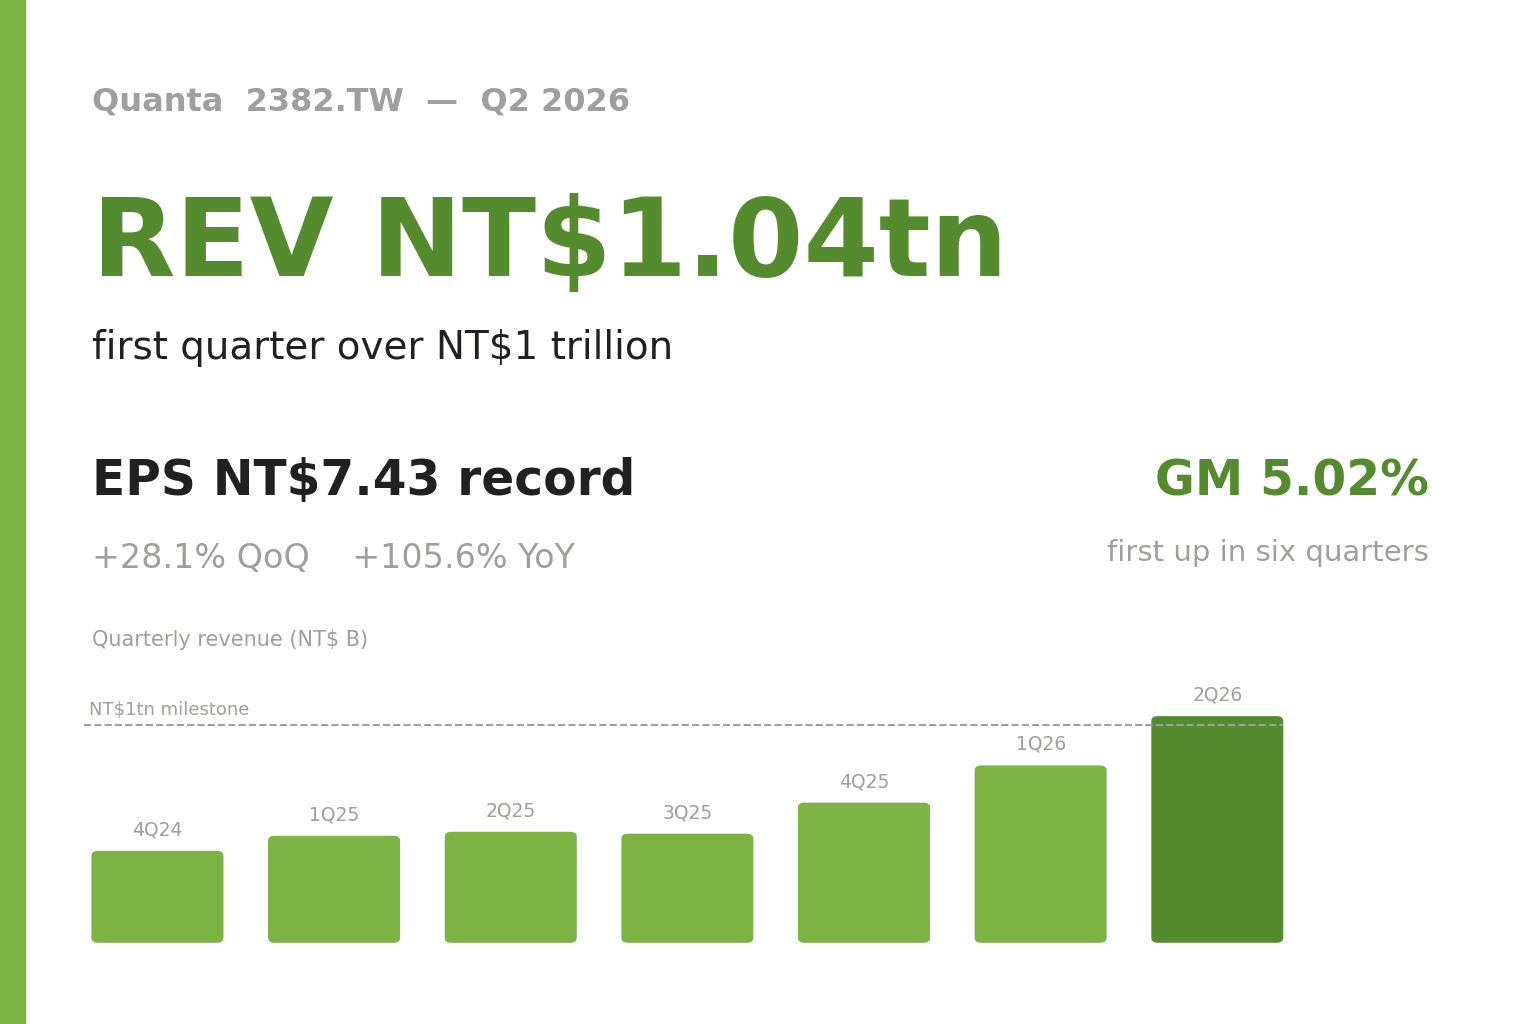
Quanta Q2 2026: Revenue Tops NT$1tn, Record NT$7.43 EPS
Quanta (2382.TW) Q2 revenue hit NT$1.04tn, up 28.1% QoQ and 105.6% YoY, a first for Taiwan. EPS set a record NT$7.43 as gross margin rose to 5.02%.
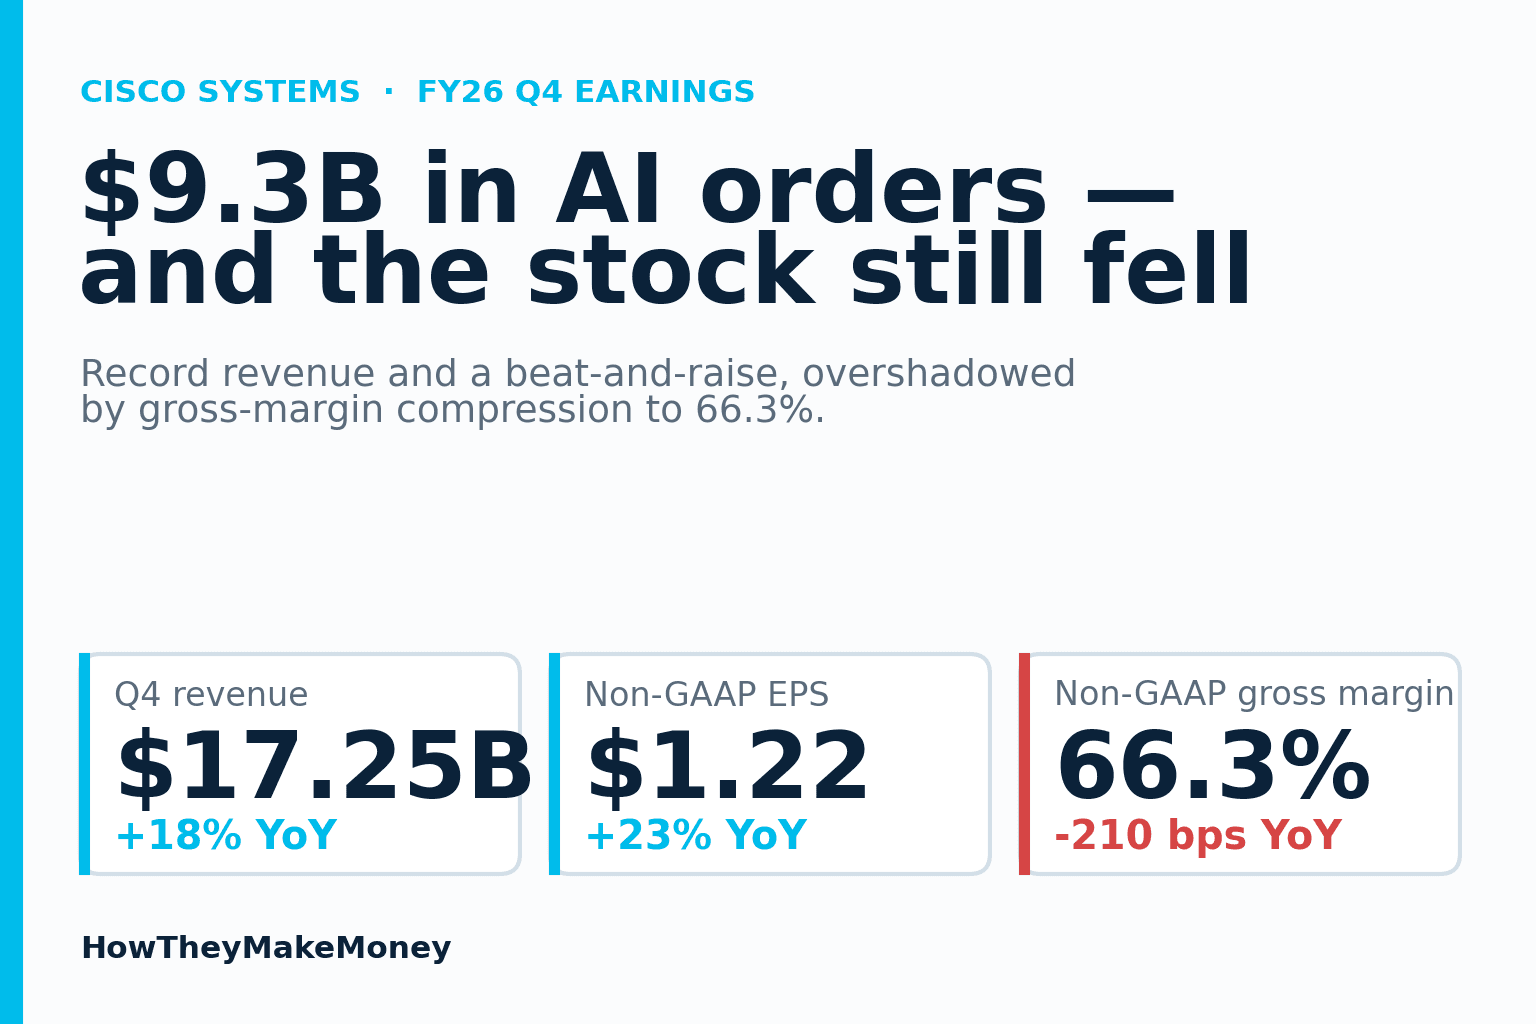
Cisco's $9.3B AI order year — and why the stock fell
Cisco closed FY26 with record $17.25B Q4 revenue and $9.3B in hyperscaler AI orders, and guided FY27 above the Street. Yet the stock fell on margin compression.
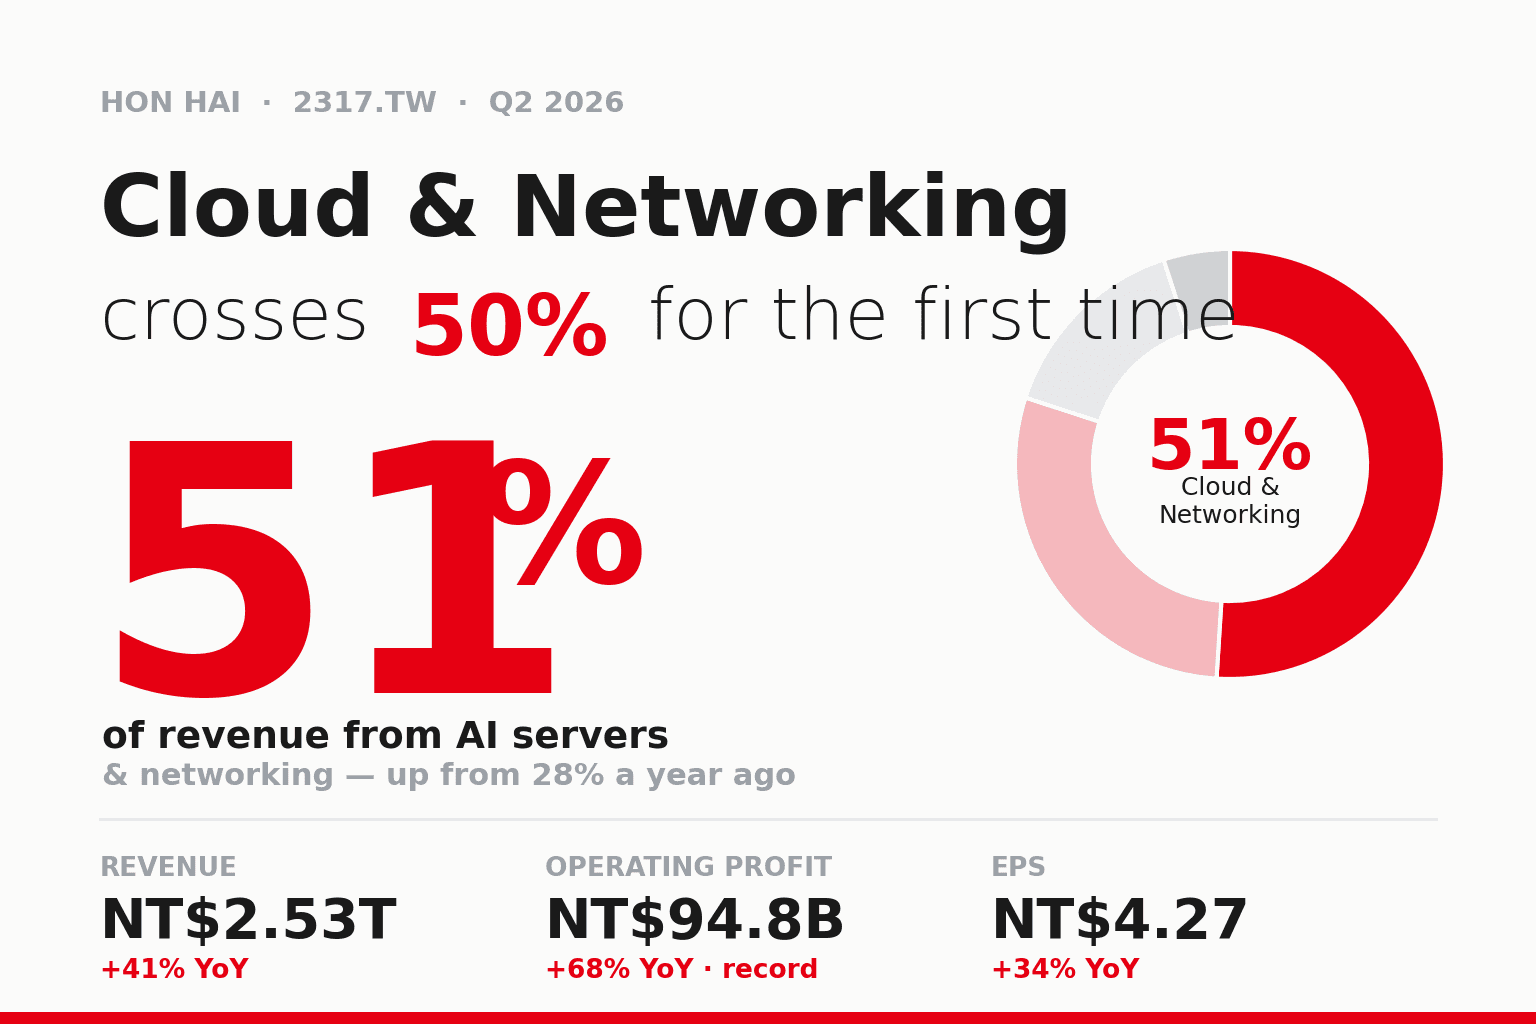
Hon Hai Q2 2026: Cloud & Networking Crosses 50% for the First Time, Operating Income Up 68% to a Record Quarter
Hon Hai (2317.TW) posted Q2 revenue of NT$2.53T, up 41% YoY, with operating income of NT$94.8B, up 68% YoY to an all-time quarterly high, and EPS of NT$4.27. Cloud & Networking topped 50% of revenue for the first time (51%, up roughly 156% YoY), making AI servers the core business at last — but first-half free cash flow swung to roughly -NT$150B, the tension hiding beneath a headline-beating quarter.
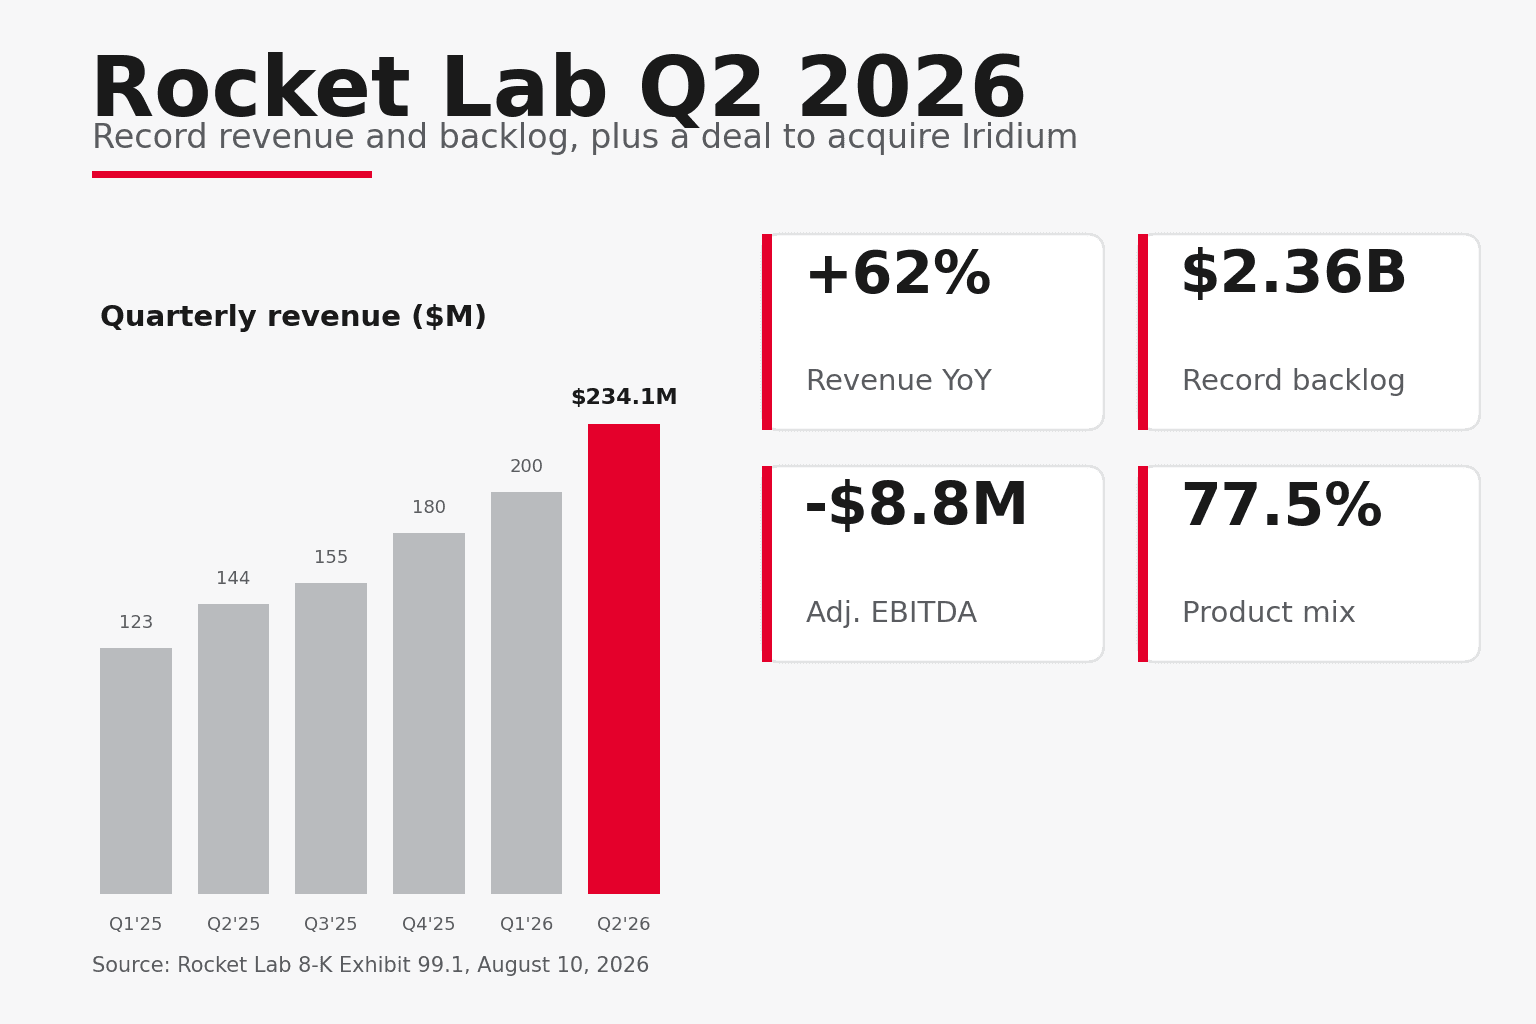
Rocket Lab Q2 2026: Record Revenue, Iridium Deal
Rocket Lab posted record Q2 2026 revenue of $234.1M, up 62%, and a record $2.36B backlog, yet shares slid after hours on a wider loss and soft margin guidance.
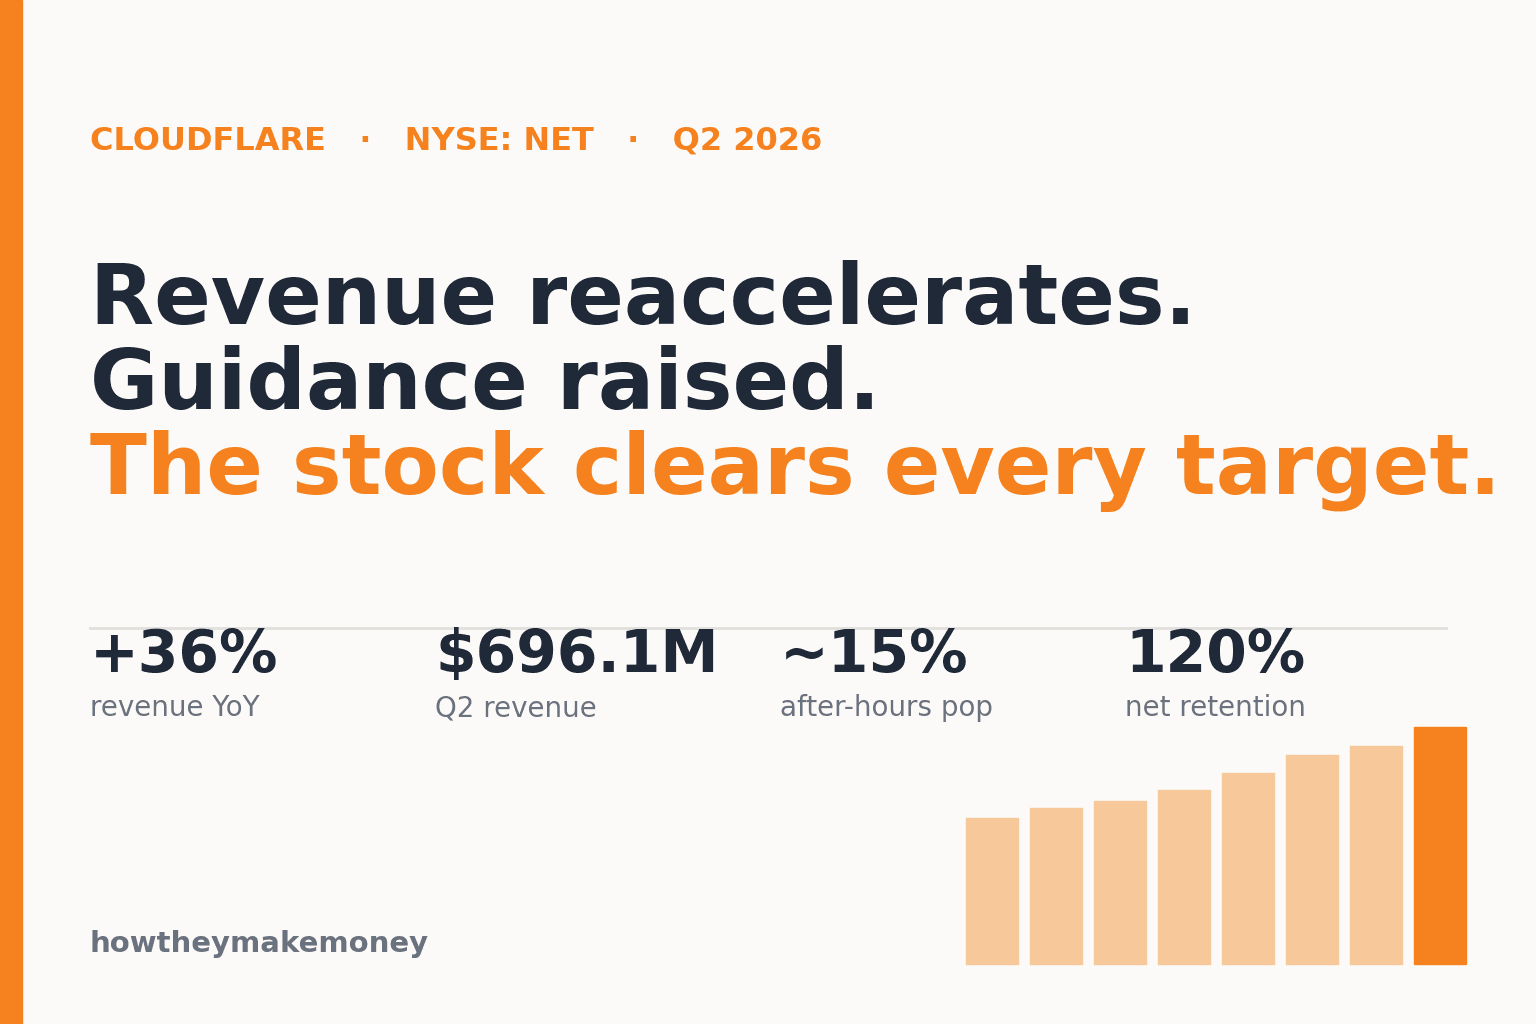
Cloudflare stock clears Wall Street's highest target
Cloudflare's Q2 2026 revenue reaccelerated to $696.1M, up 36%, and it raised full-year guidance. The stock jumped ~15% to a record, past every analyst target.
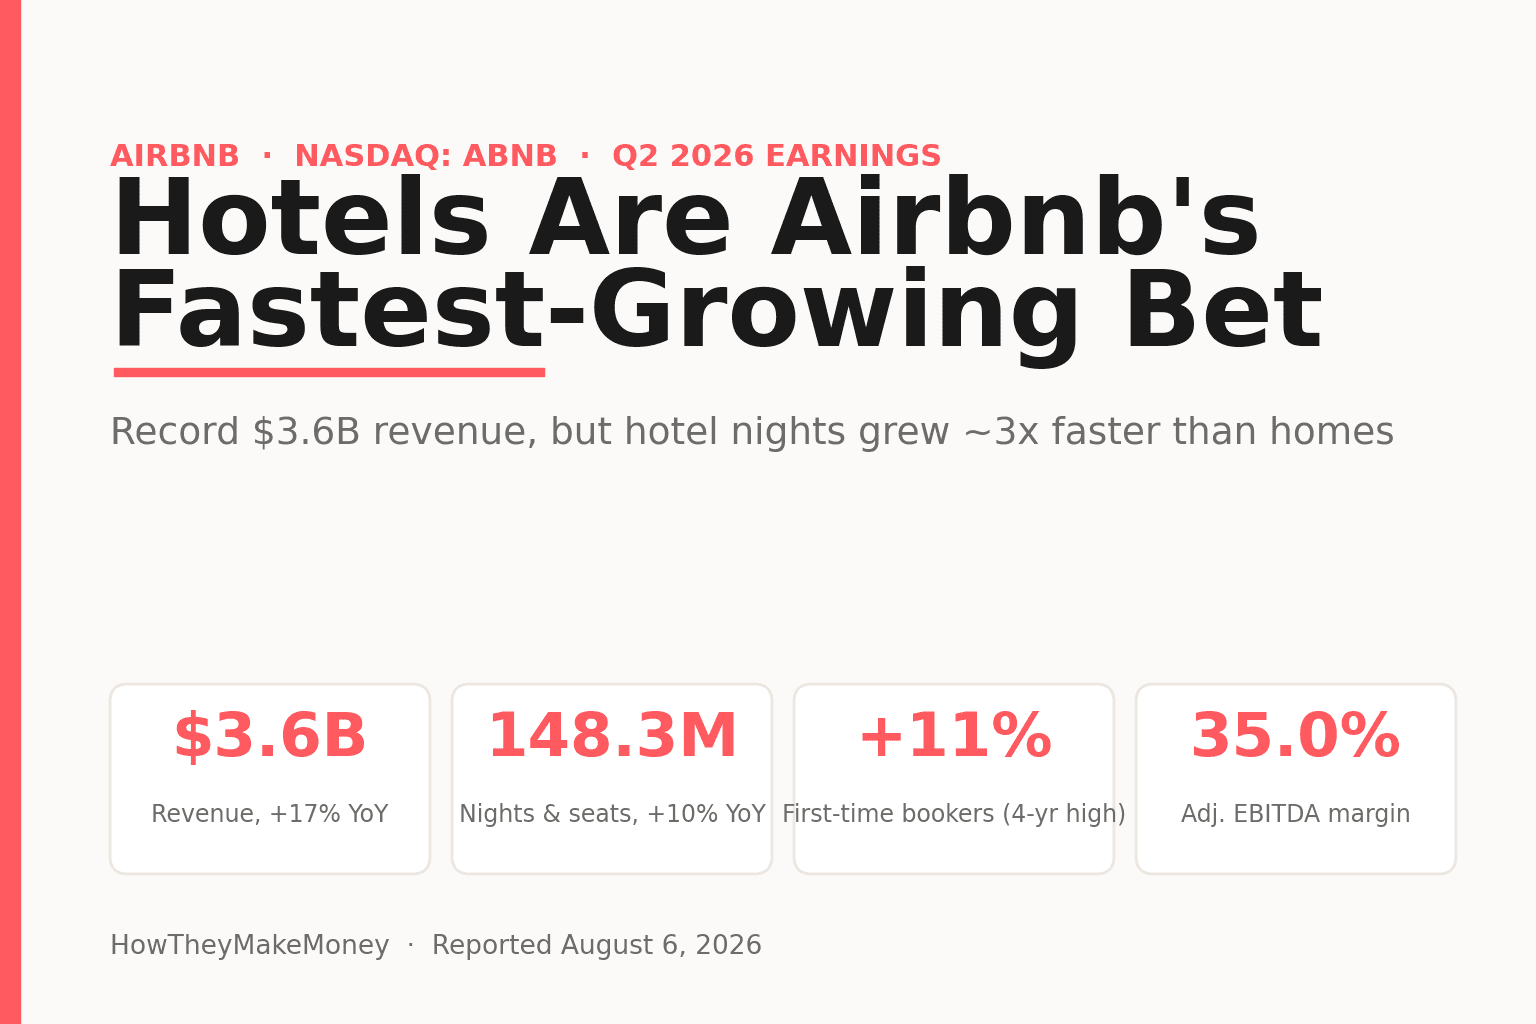
Airbnb Q2 2026: Hotels Grow 3x Faster Than Homes
Airbnb's Q2 2026 revenue hit a record $3.6 billion, up 17%, but hotels grew about 3x faster than homes and first-time bookers hit a four-year high.
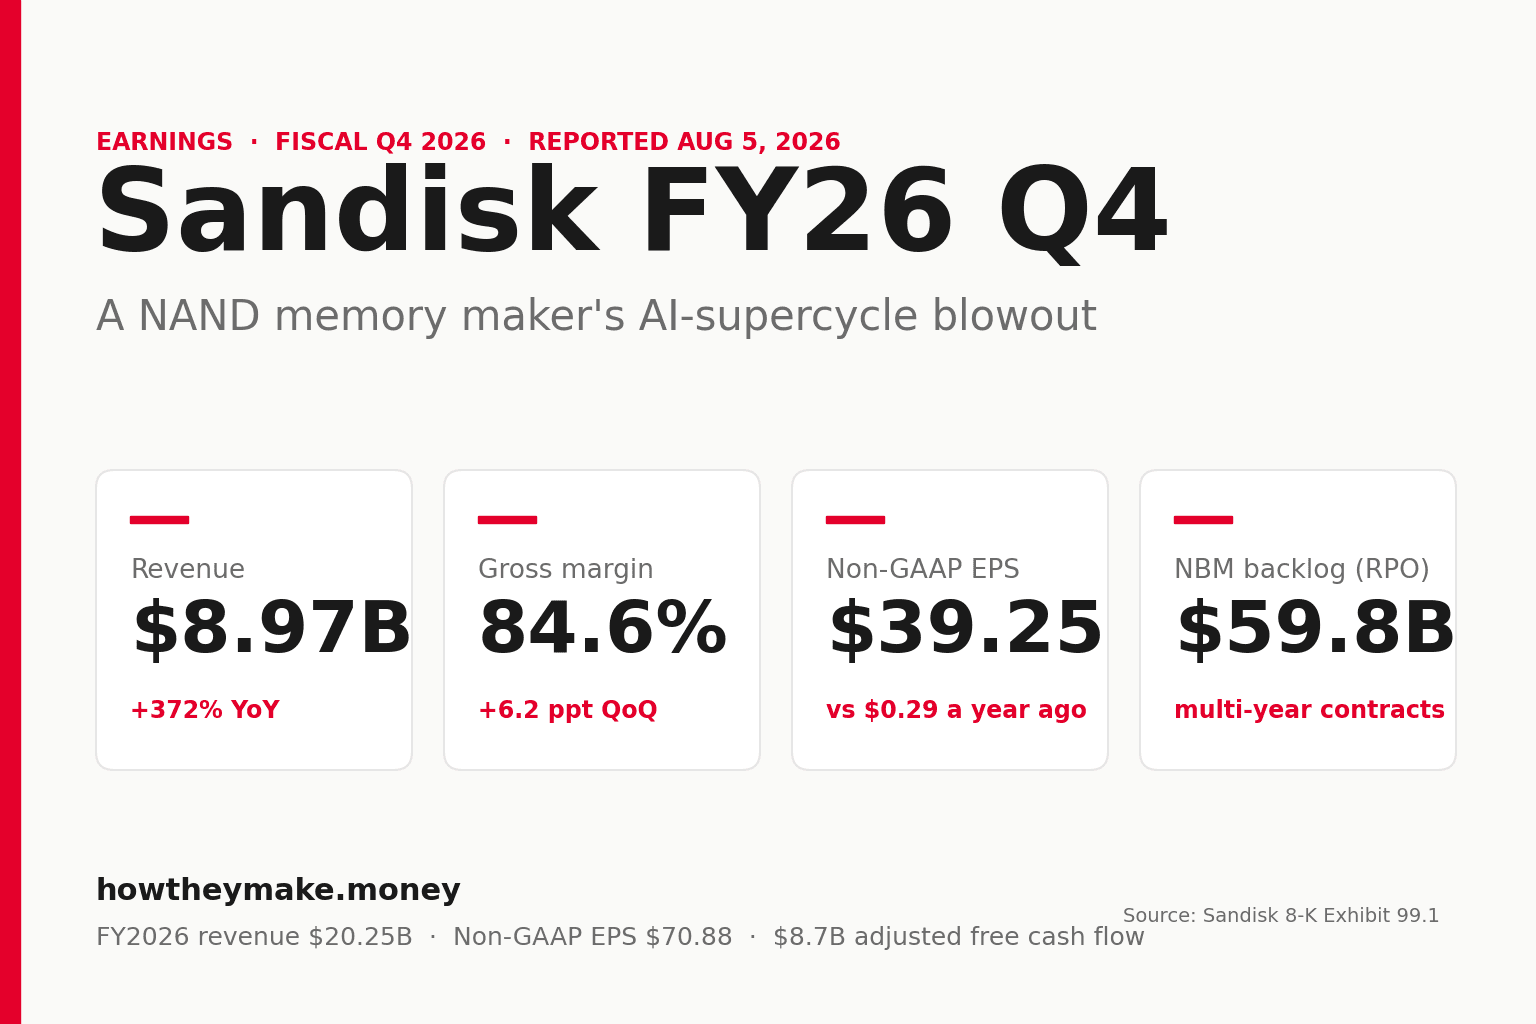
Sandisk's NAND Supercycle: Record Margins, Stock Falls
Sandisk's fiscal Q4 revenue rocketed 372% to $8.97B on AI-driven NAND demand, gross margin hit 84.6% and non-GAAP EPS reached $39.25, yet the stock still fell.
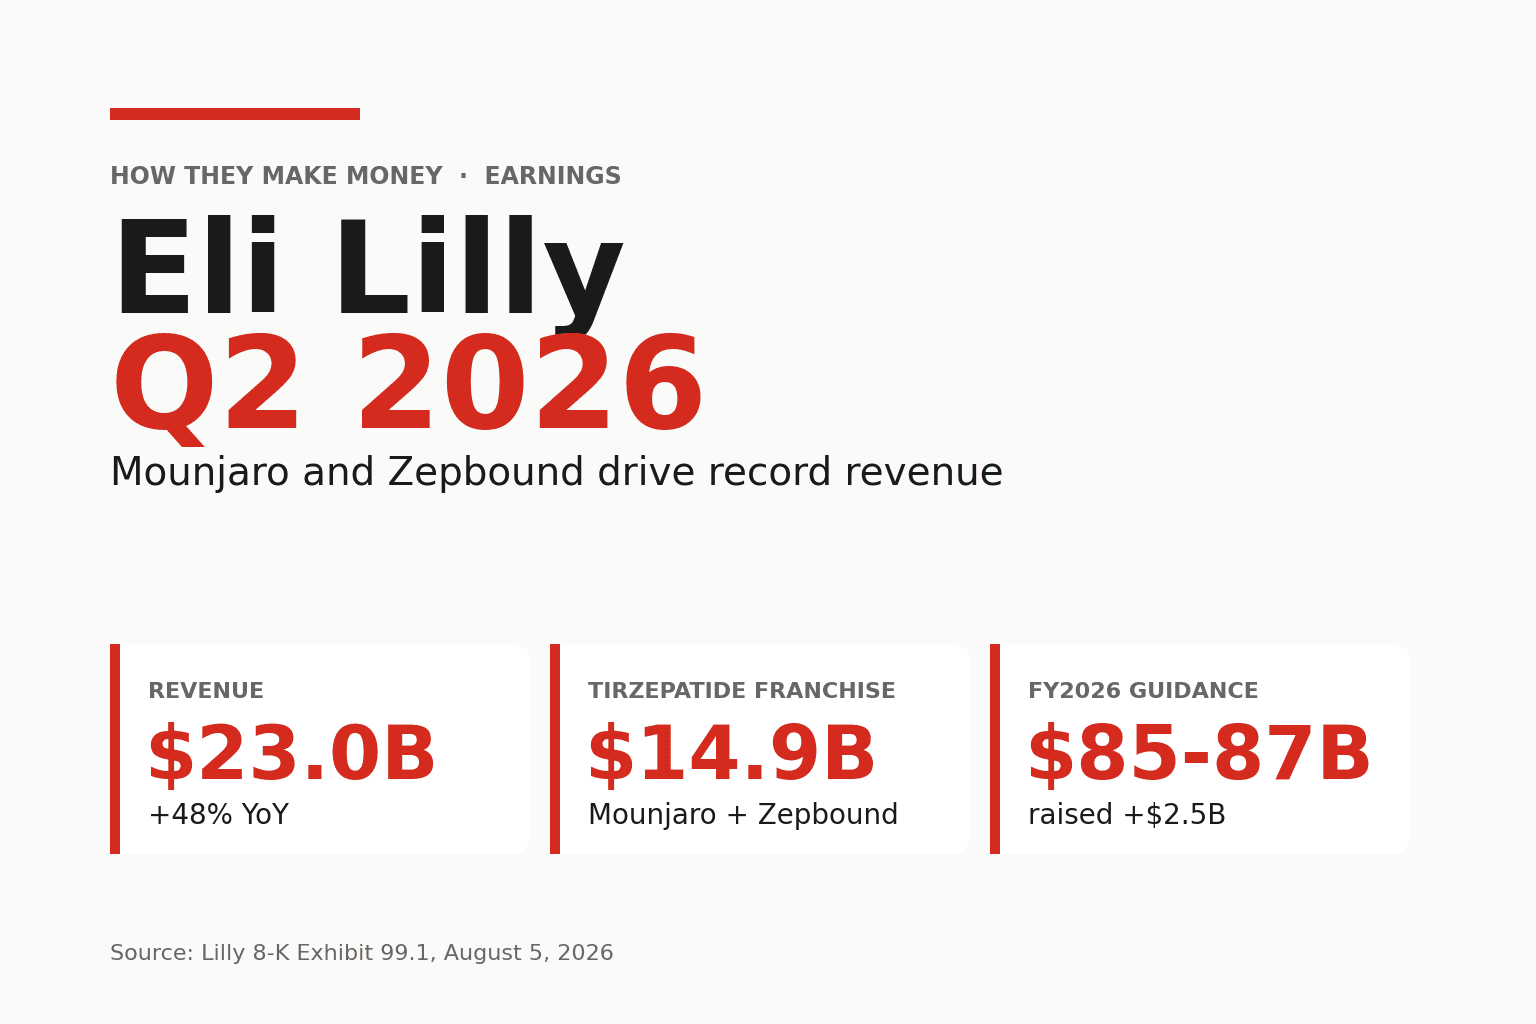
Eli Lilly Q2 2026: Mounjaro, Zepbound Drive Record Sales
Eli Lilly's Q2 2026 revenue rose 48% to $23.0B as Mounjaro and Zepbound topped $14.9B, non-GAAP EPS hit $8.38, and full-year guidance climbed to $85-87B.
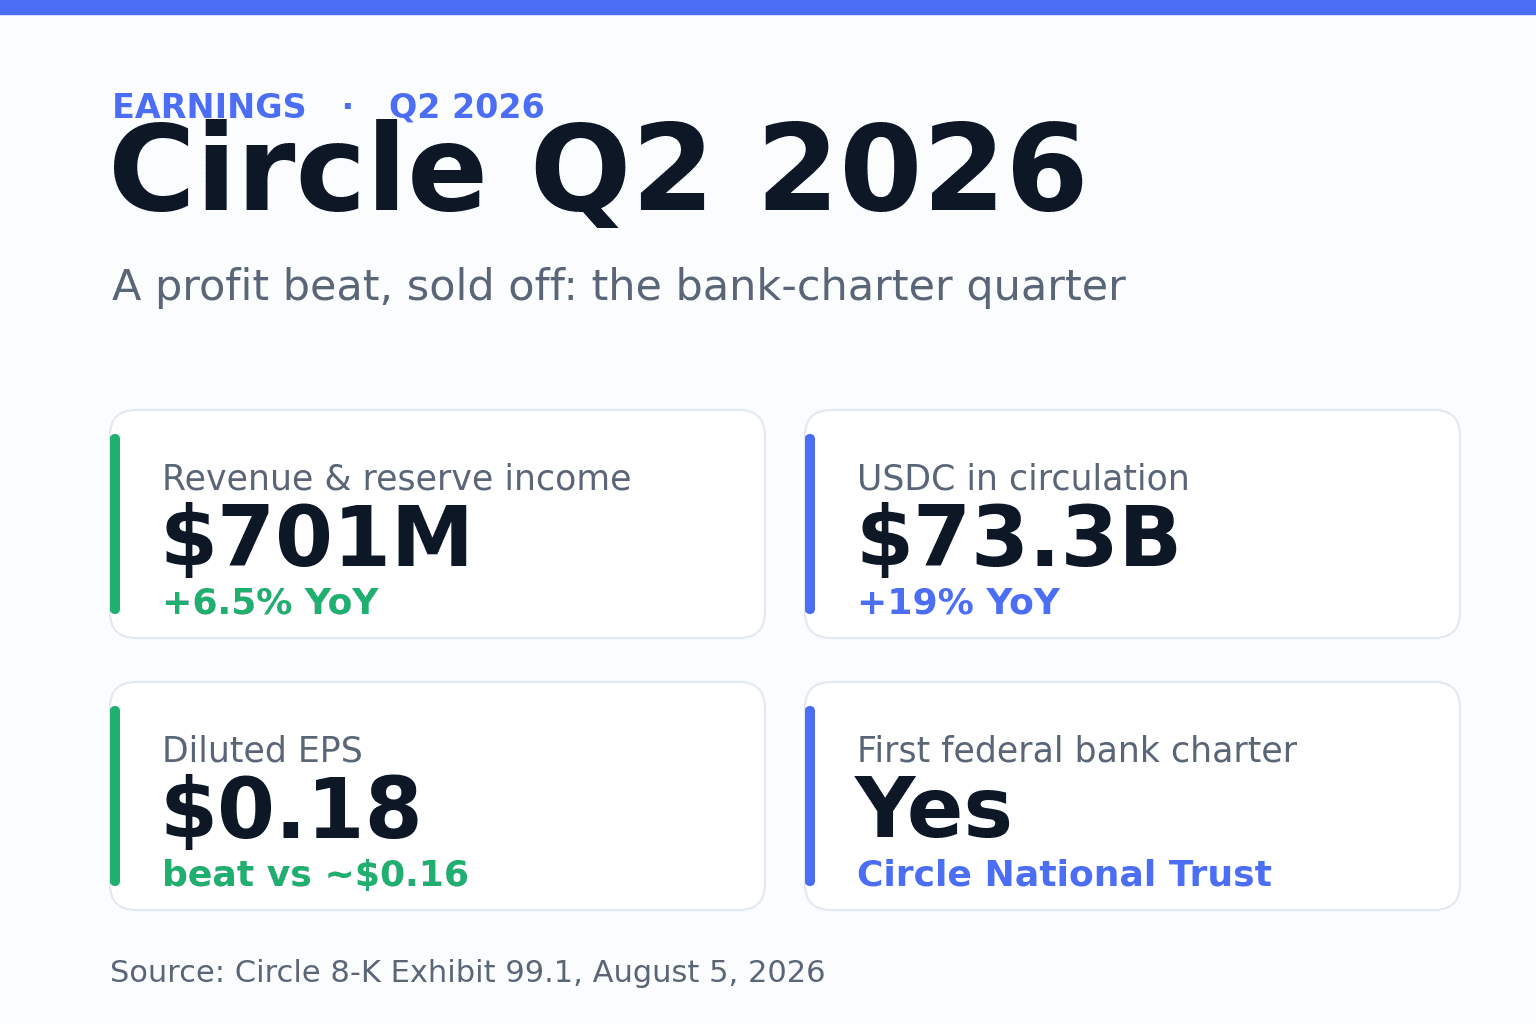
Circle Q2 2026: A Bank Charter, and a Sold-Off Beat
Circle beat on profit and won the first federal bank charter for a stablecoin issuer, yet USDC shrank sequentially and the stock faded a 7% pop to close lower.
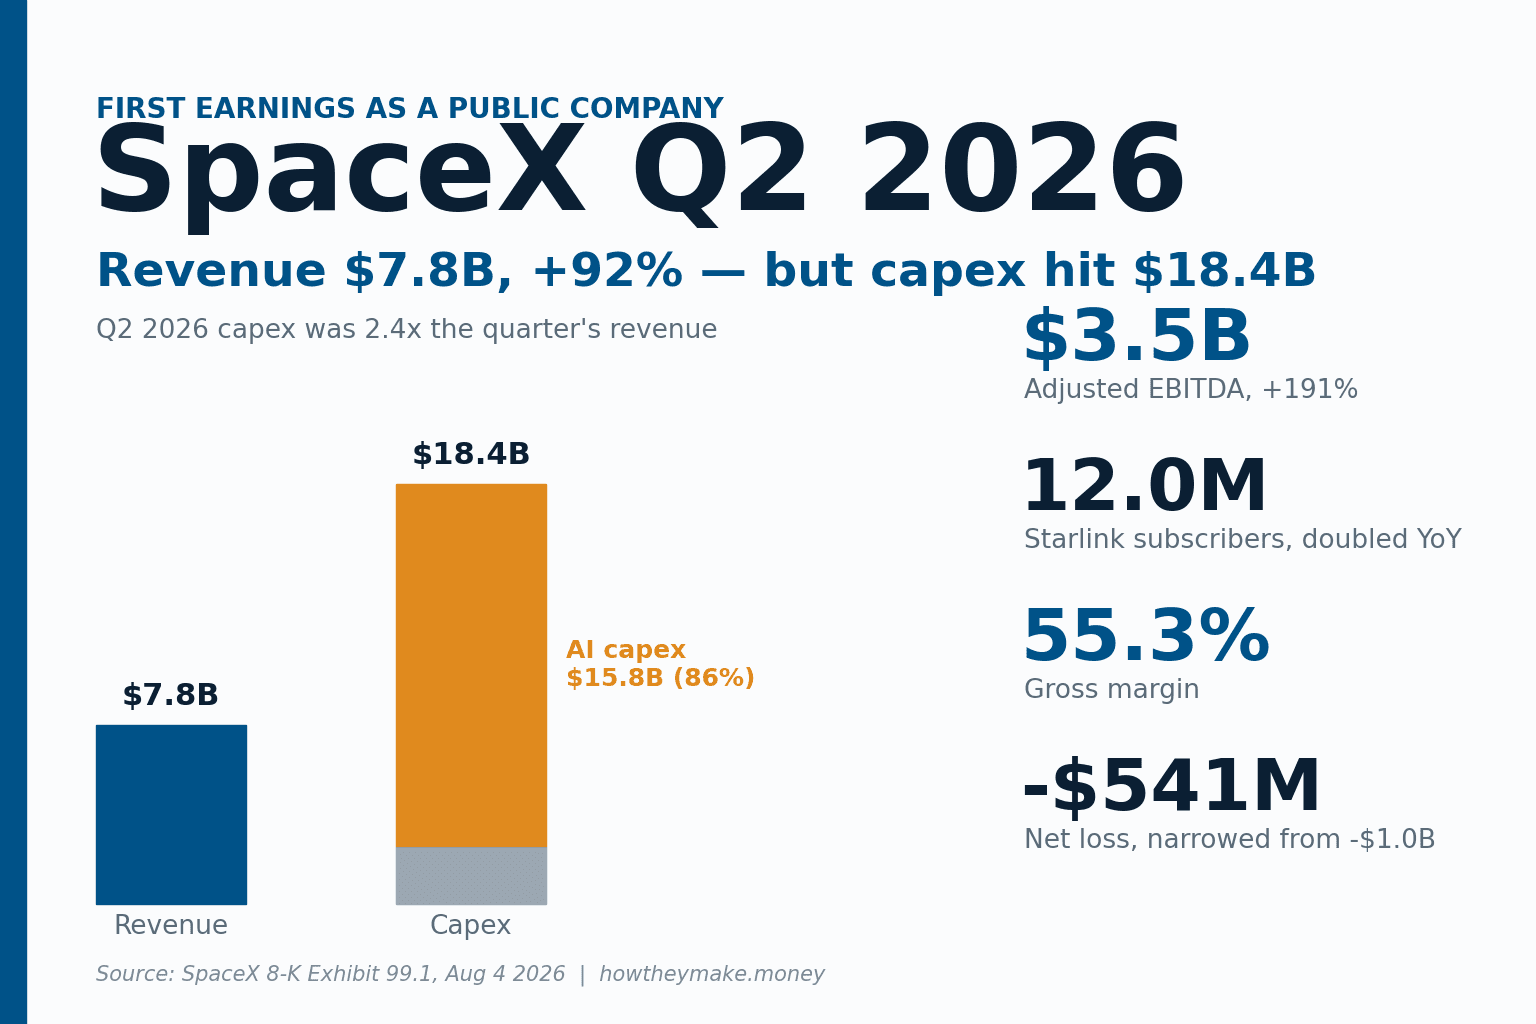
SpaceX's First Earnings: A Big Beat, a Bigger Capex Bill
SpaceX's first quarter as a public company: revenue rose 92% to $7.8B and Starlink turned profitable, yet $18.4B of capex sank the stock after hours.
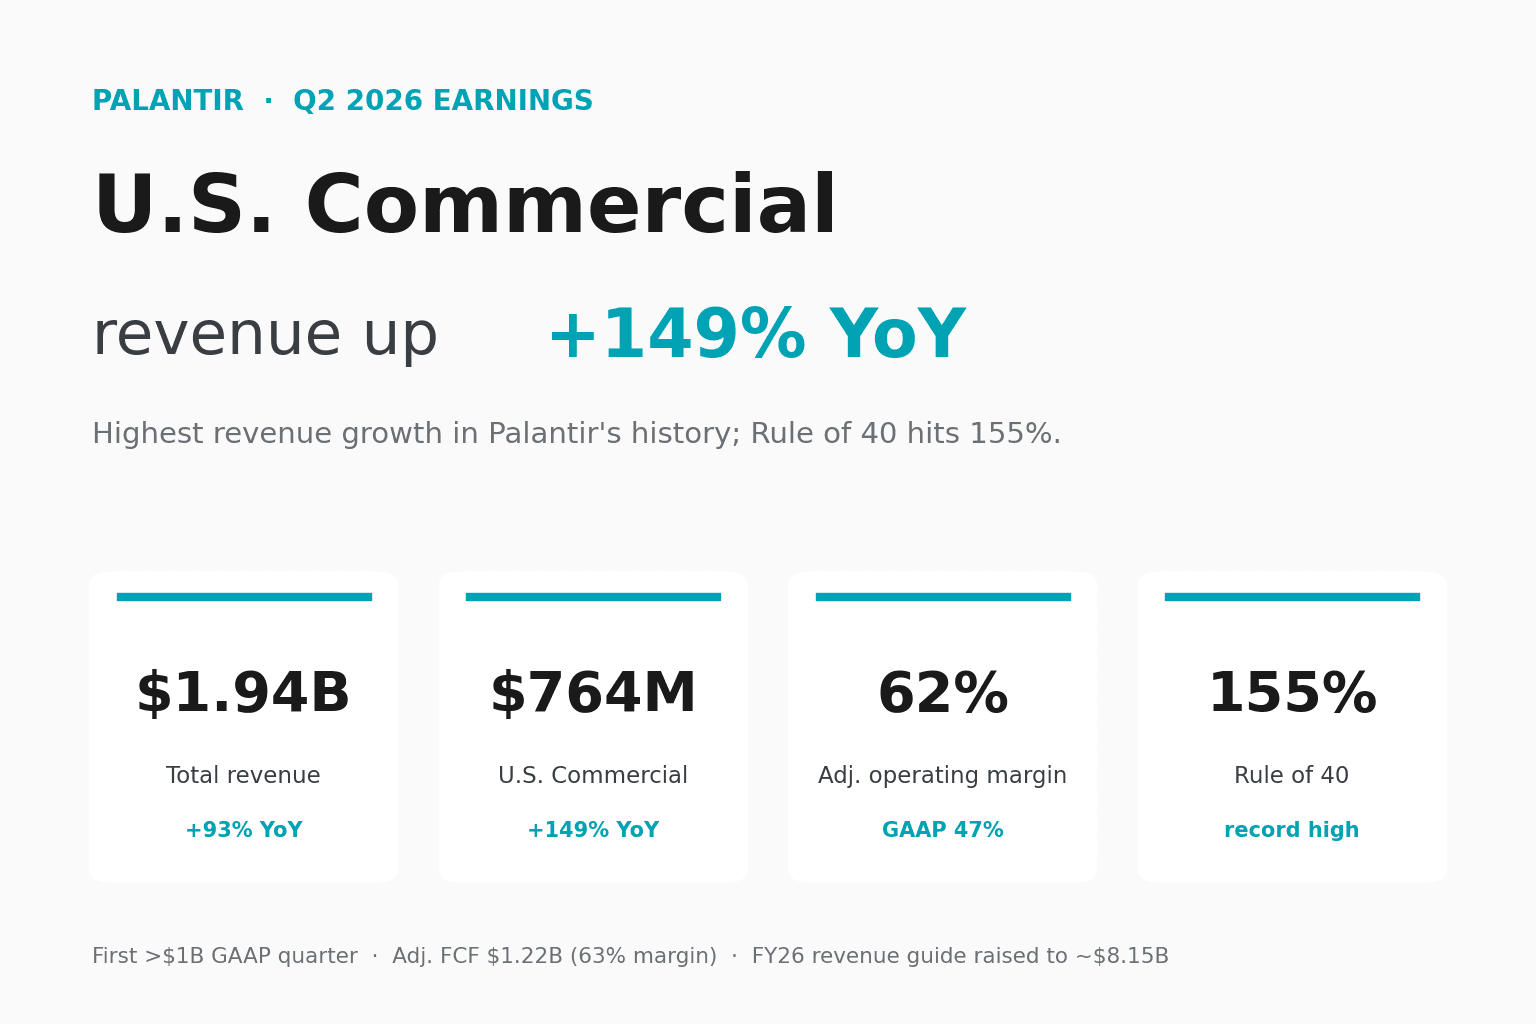
Palantir's U.S. commercial revenue jumps 149% in Q2 2026
Palantir grew revenue 93% to $1.94B, its fastest ever, led by U.S. commercial sales up 149%. It booked its first billion-dollar GAAP profit and raised guidance.
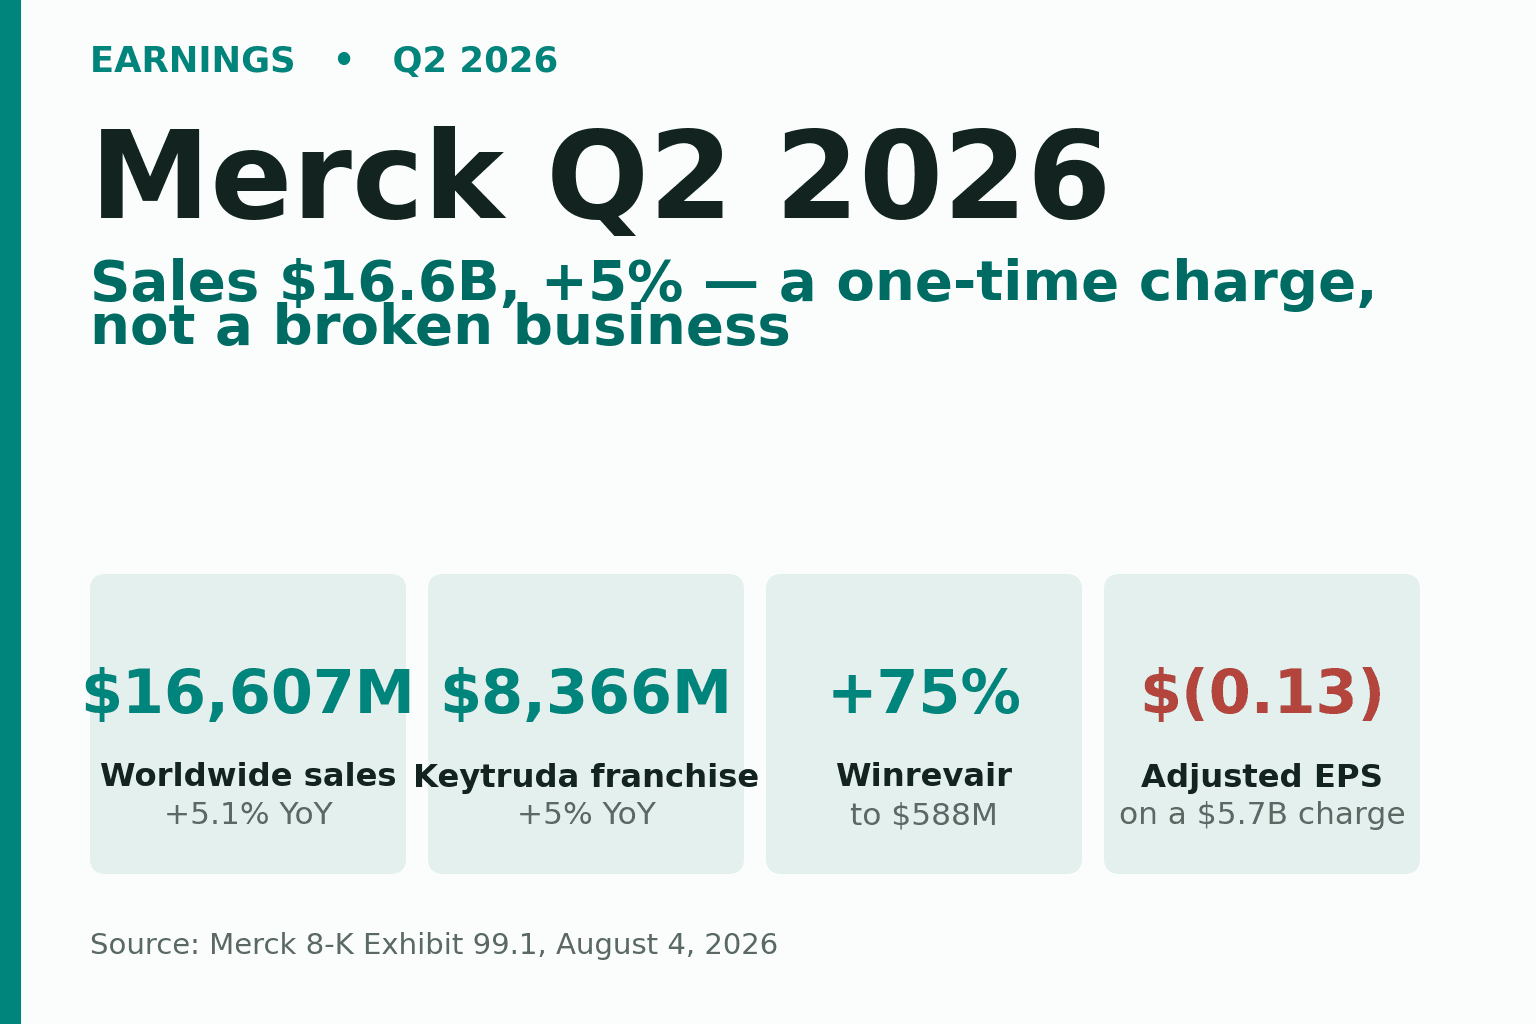
Merck's Q2 Loss Is an Accounting Artifact, Not a Miss
Merck's Q2 2026 sales beat at $16.6B, up 5%, yet the headline was a net loss. A one-time $5.7B Terns charge did all the damage, and the market saw through it.
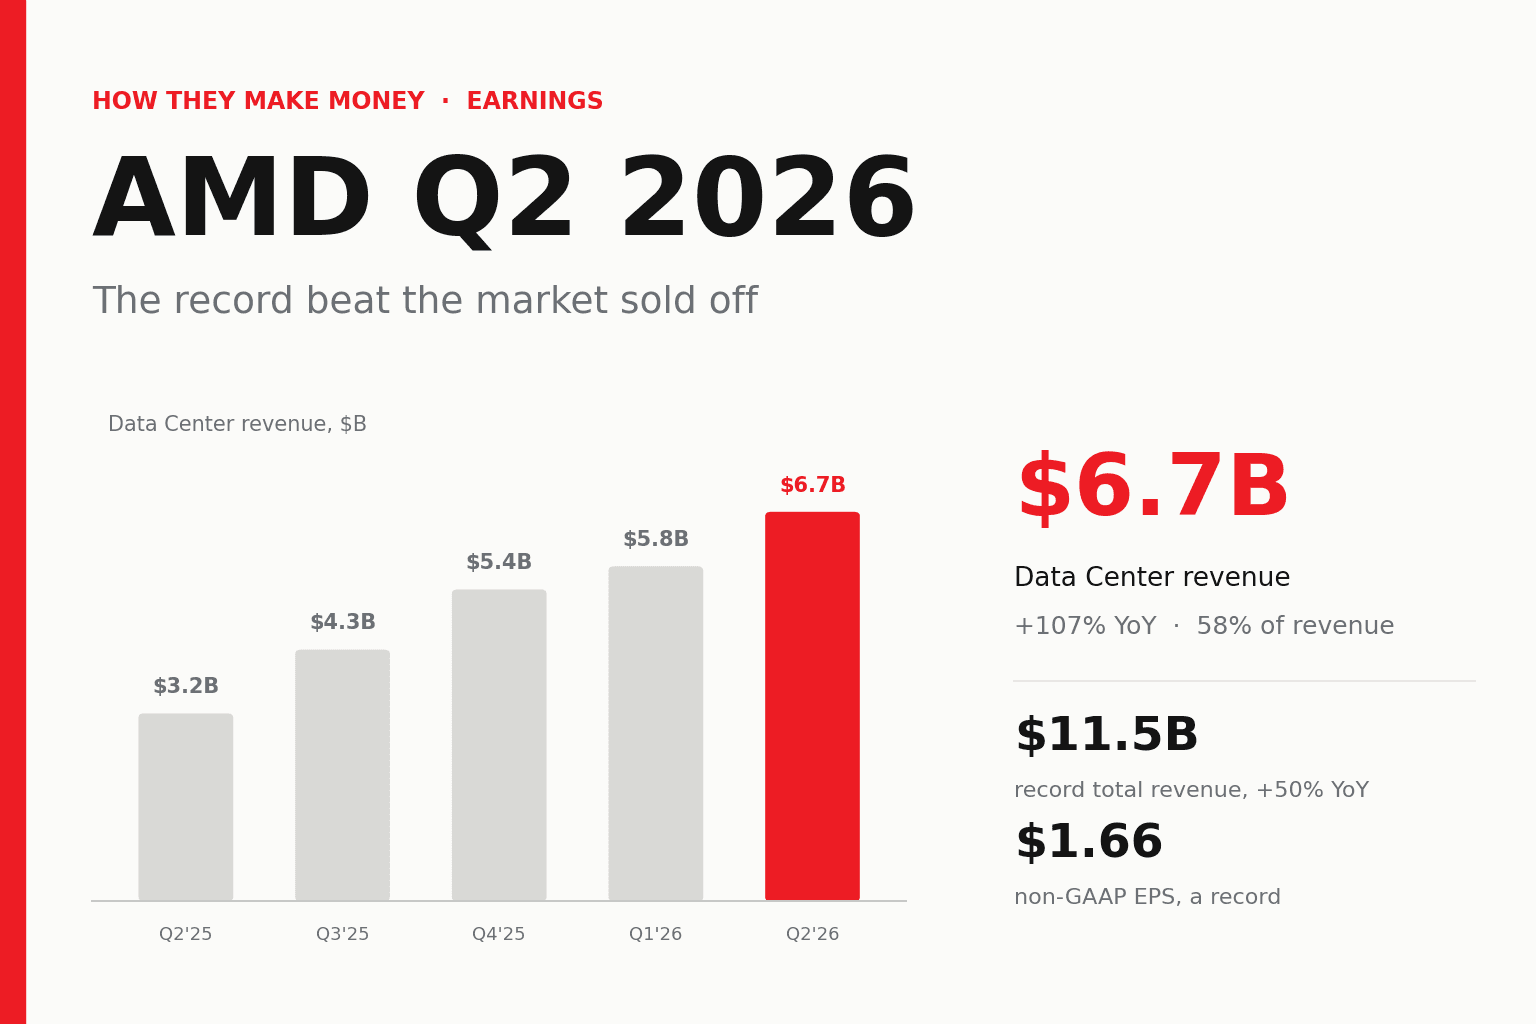
AMD Q2 2026: A Record Beat That the Market Still Sold Off
AMD's record Q2 2026 print: revenue $11.5B, Data Center up 107% to reach 58% of sales, yet the stock still fell nearly 9% as capex more than doubled.
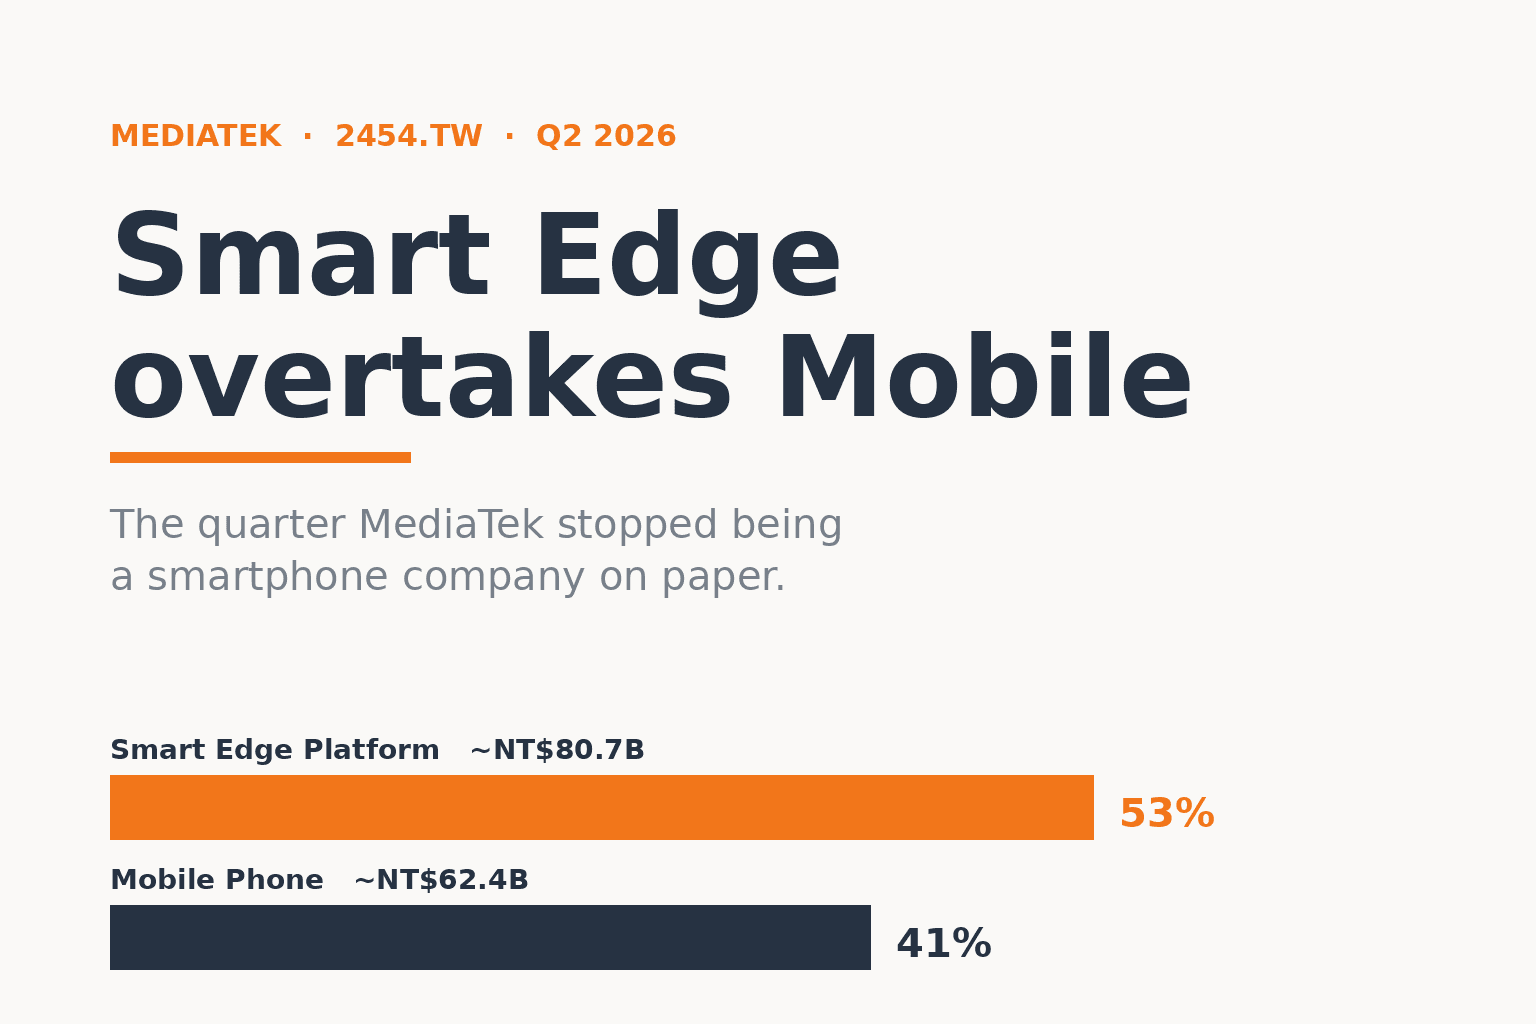
MediaTek Q2 2026: Smart Edge Platform Overtakes Mobile
MediaTek Q2 2026 revenue hit NT$152.2B, a five-quarter high above guidance, with EPS NT$15.28. Smart Edge Platform's 53% overtook Mobile's 41% as top segment.
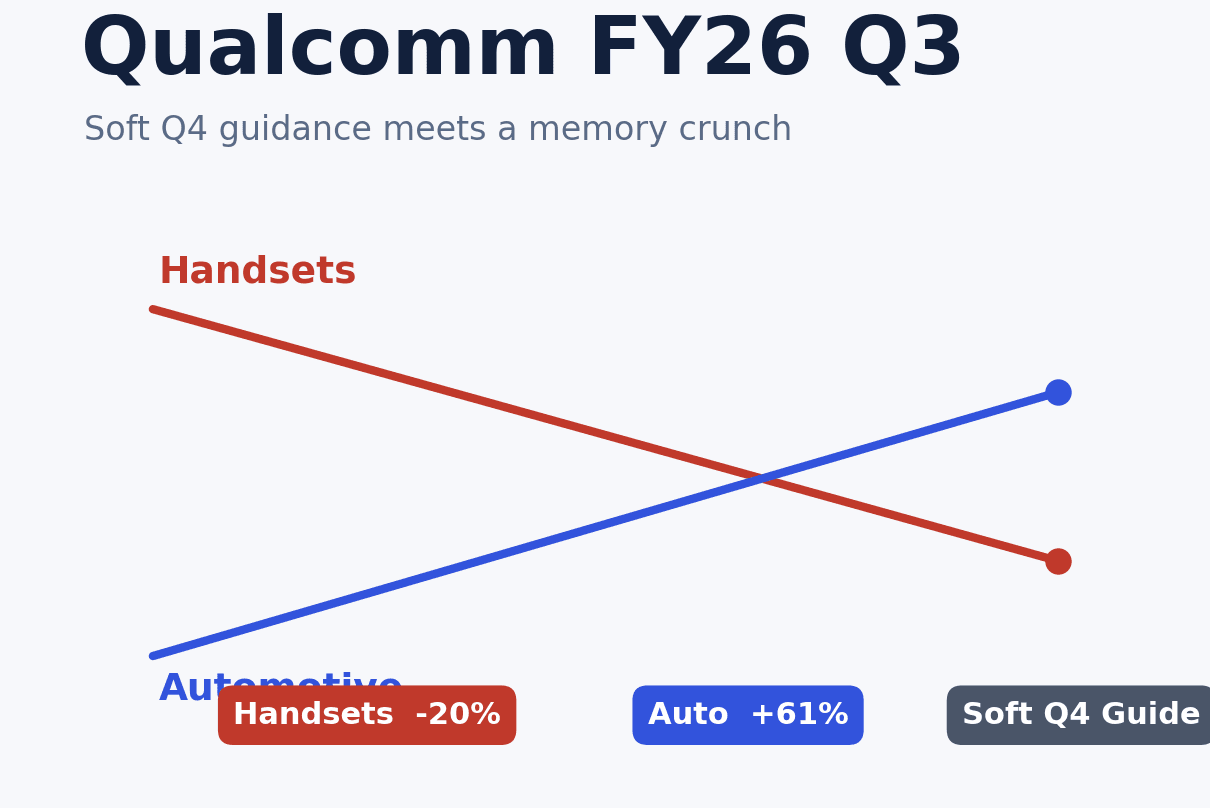
Qualcomm FY26 Q3: Soft Guidance Amid Memory Crunch
Qualcomm's fiscal Q3 2026 revenue fell 4% to $9.95B at guidance's high end, but a soft Q4 outlook on the memory crunch and Apple loss sank the stock 7%.
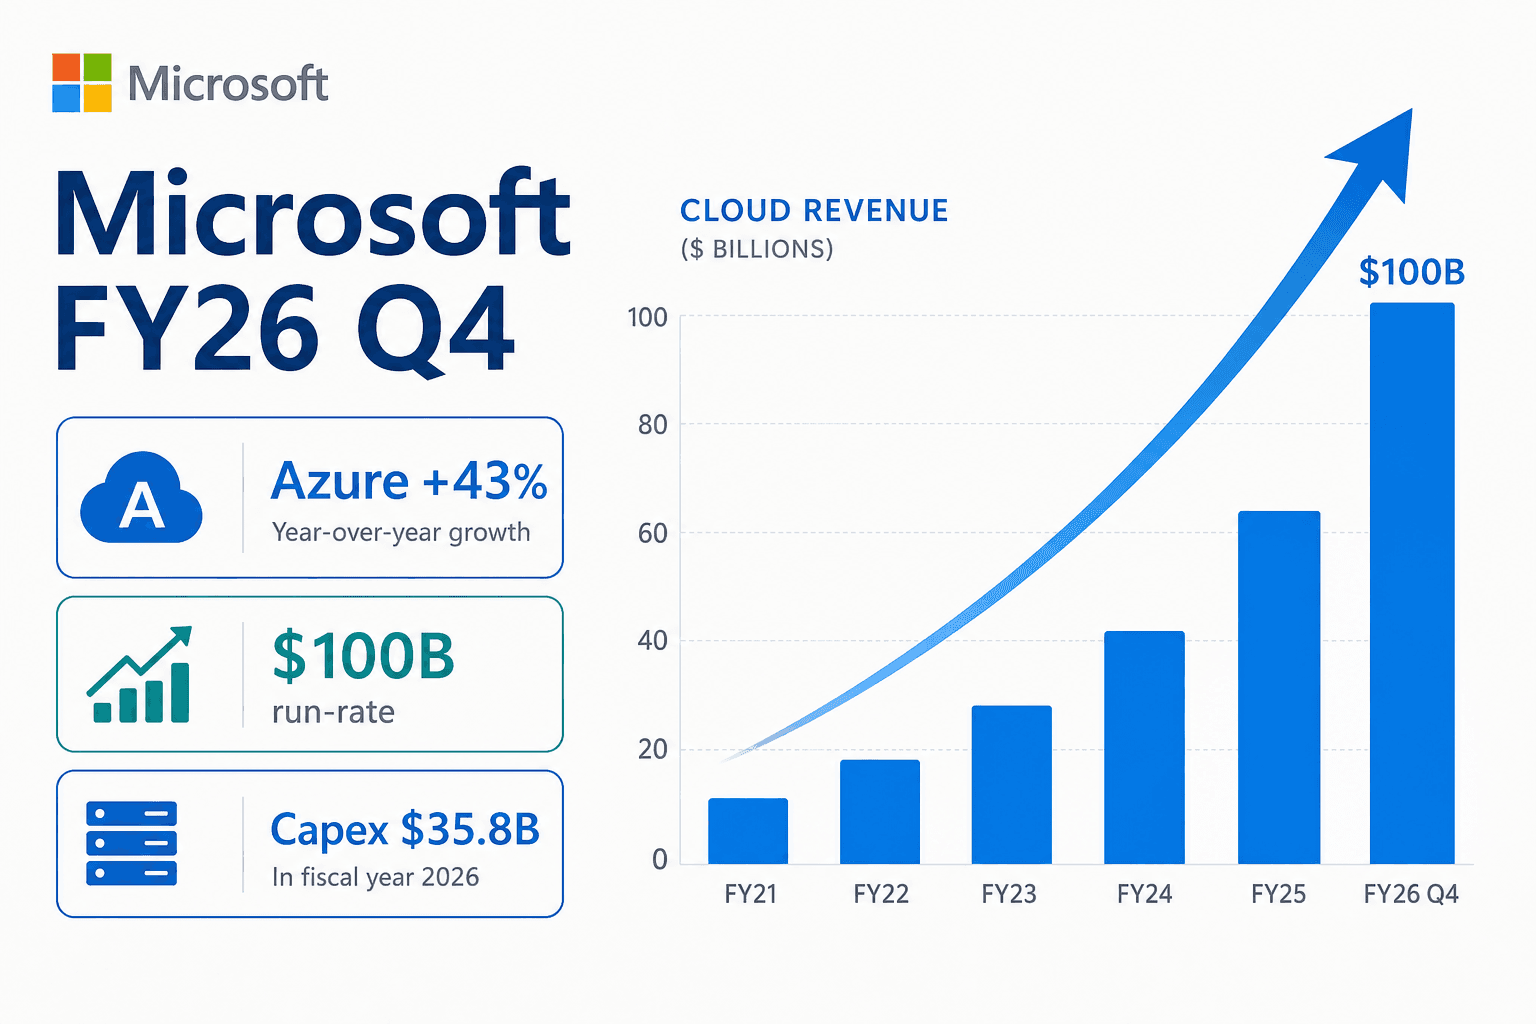
Microsoft FY26 Q4: Azure Reaccelerates to 43%
Microsoft's fiscal Q4 2026 revenue rose 18% to $90B as Azure reaccelerated to 43% and crossed a $100B run-rate, while cash capex doubled to a record $35.8B.
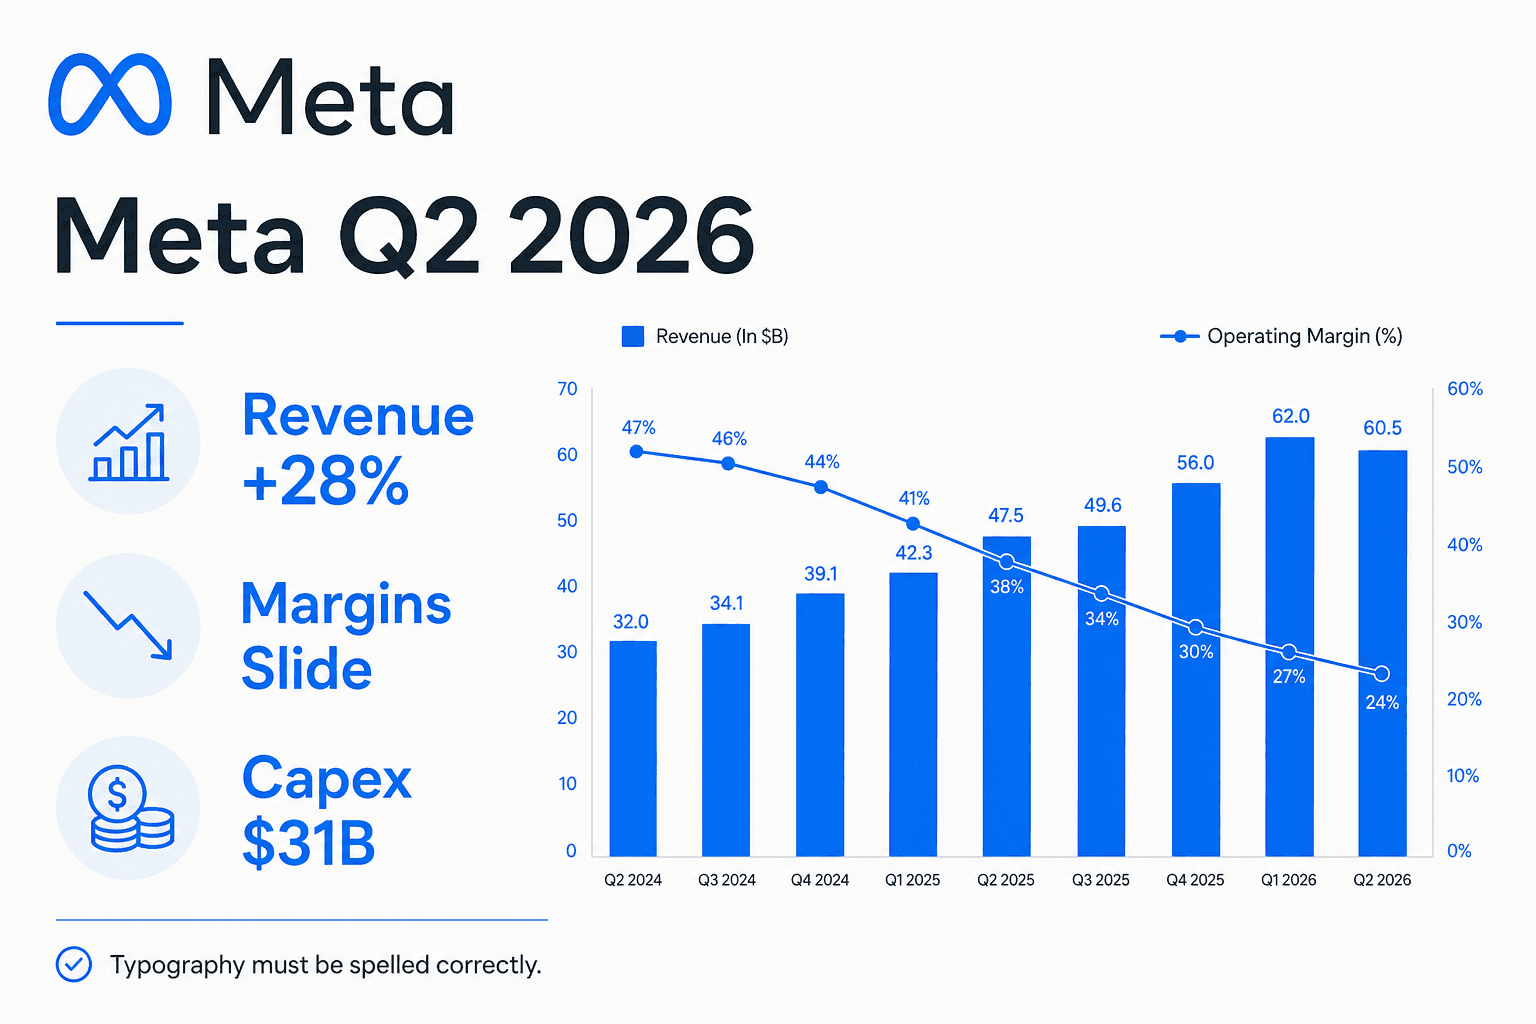
Meta Q2 2026: Revenue +28%, Margins Crushed
Meta's Q2 2026 revenue jumped 28% to $60.8B, but EPS of $6.18 fell 13% and missed, operating margin sank to 31%, and free cash flow collapsed to $784M.
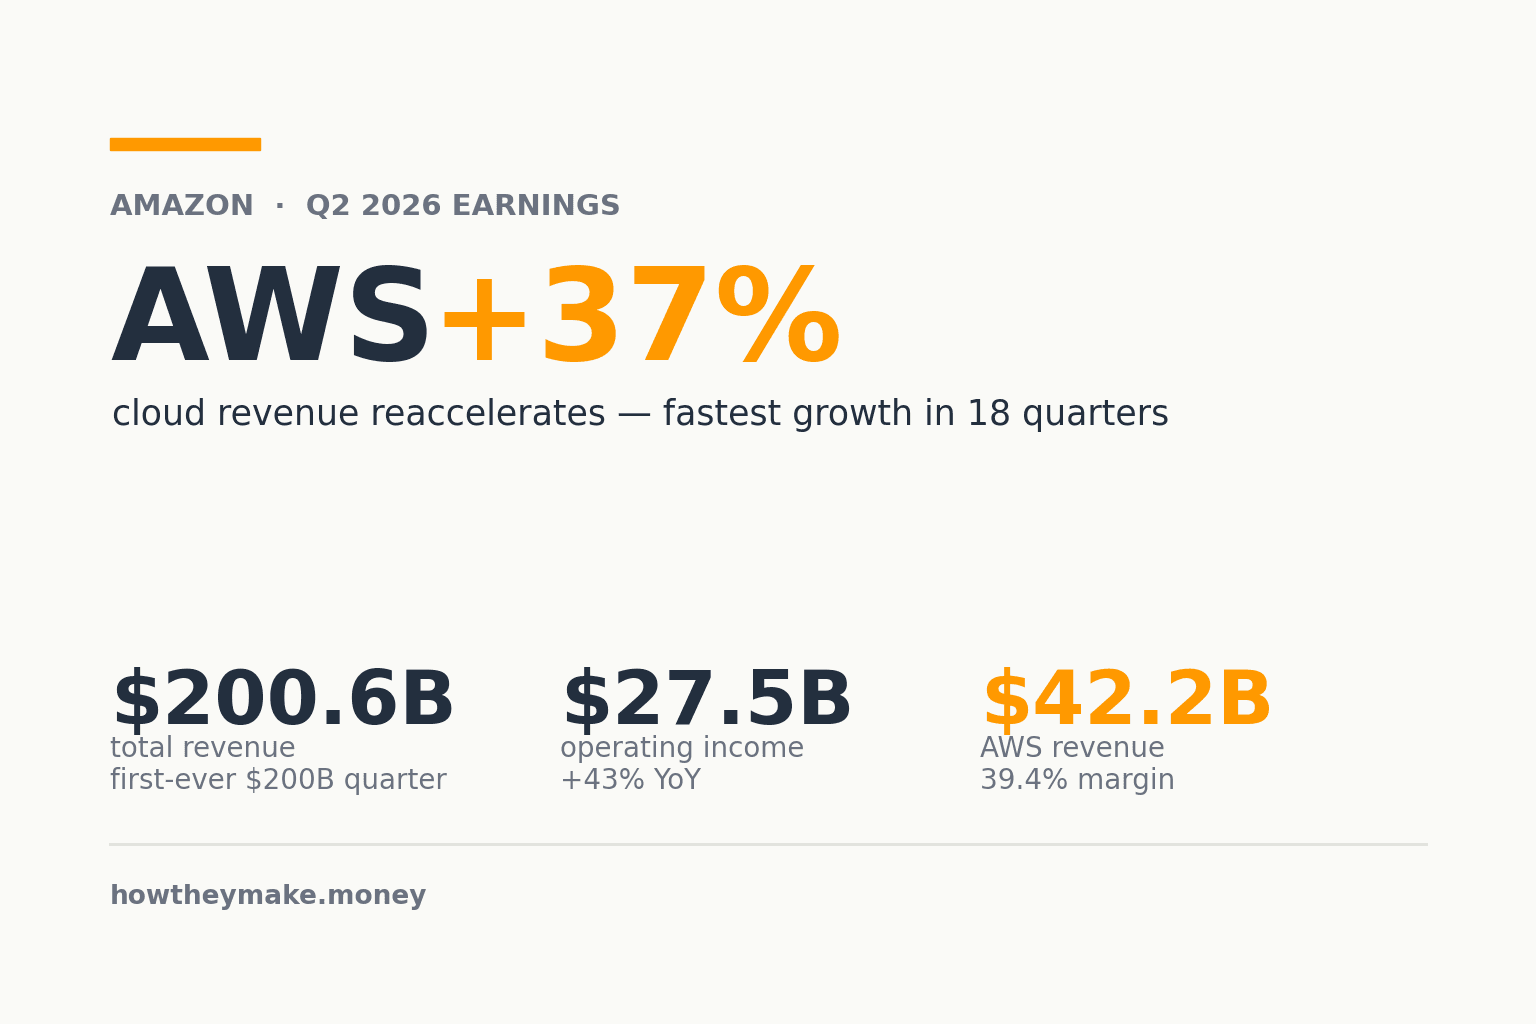
AWS reaccelerates to 37% in Amazon's first $200B quarter
Amazon posted its first $200B non-holiday quarter as AWS grew 37% to $42.2B, its fastest in 18 quarters, while operating income rose 43% to a record $27.5B.
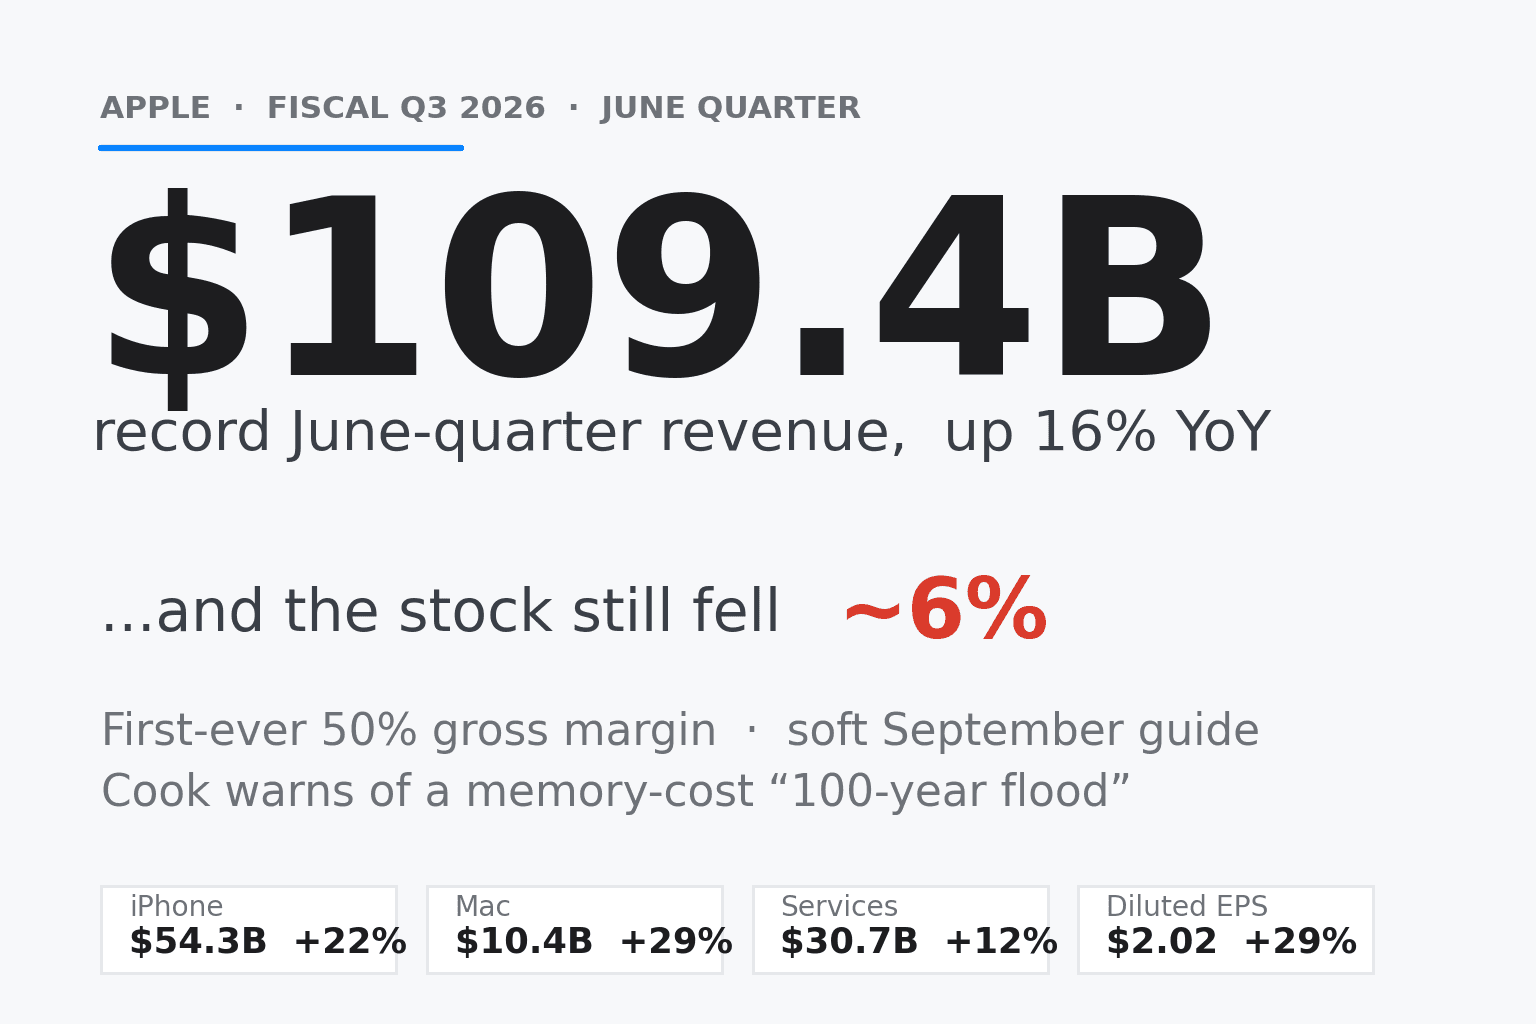
Apple's record June quarter, and the sell-off that followed
Apple posted record June-quarter revenue of $109.4B and its first 50% gross margin, yet shares fell ~6% on soft September guidance and a memory-cost warning.
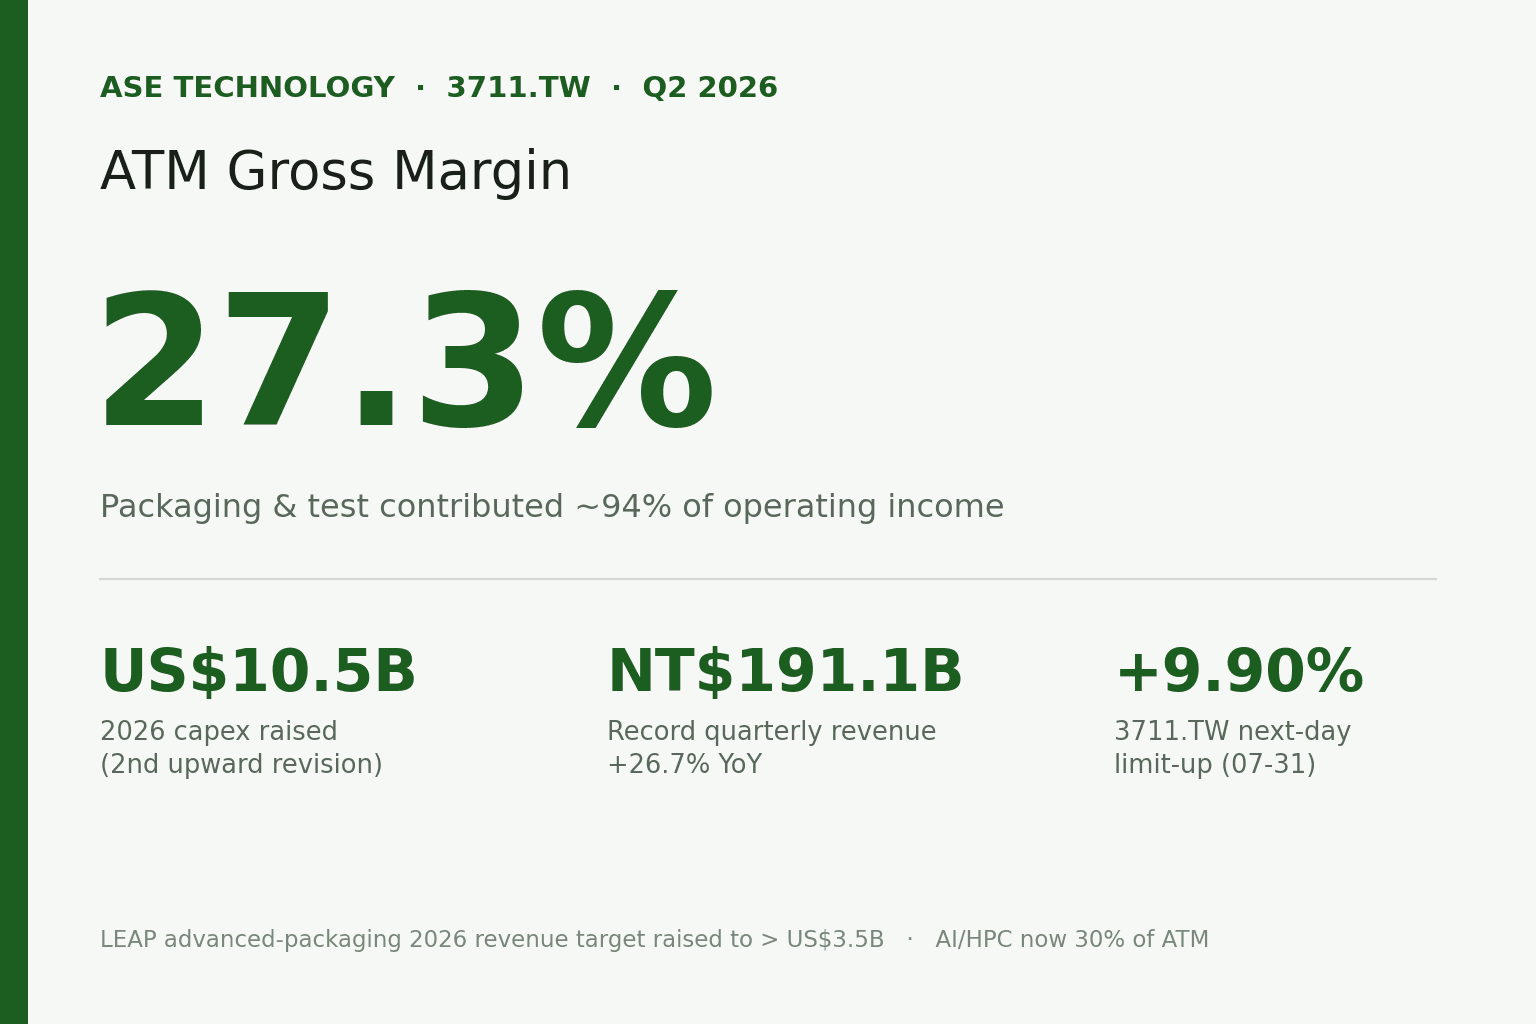
ASE Technology Q2 2026: Packaging Is the Profit Engine, and One Earnings Report Sent the Stock Limit-Up
ASE Technology (3711.TW) posted record Q2 2026 consolidated revenue of NT$191,064M (up 10.0% QoQ, 26.7% YoY). Packaging & test (ATM) gross margin jumped to 27.3% and, at ~66% of revenue, delivered ~94% of operating income. Basic EPS was NT$4.80. Full-year 2026 capex was raised a second time to ~US$10.5B, the LEAP advanced-packaging revenue target lifted to more than US$3.5B, and the day after the call 3711.TW locked limit-up +9.90% to NT$555.
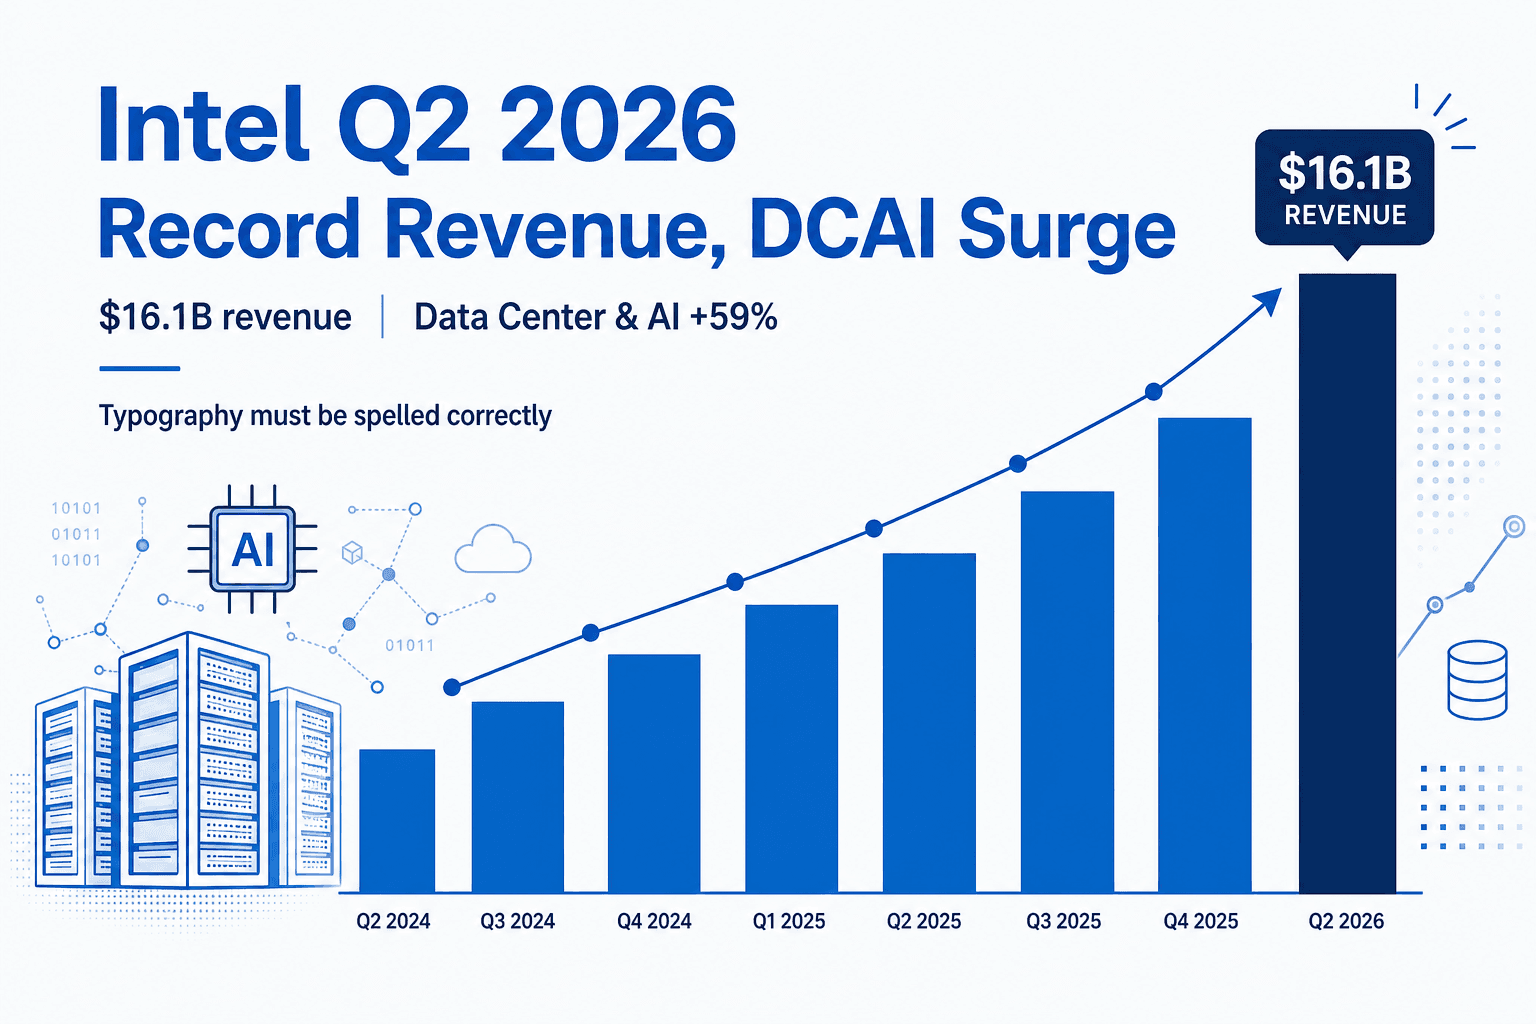
Intel Q2 2026: Record Revenue, Data Center Surge
Intel posted record Q2 2026 revenue of $16.1B, up 25%, as Data Center & AI jumped 59% and margins hit multi-year highs, while a non-cash charge sank GAAP EPS.
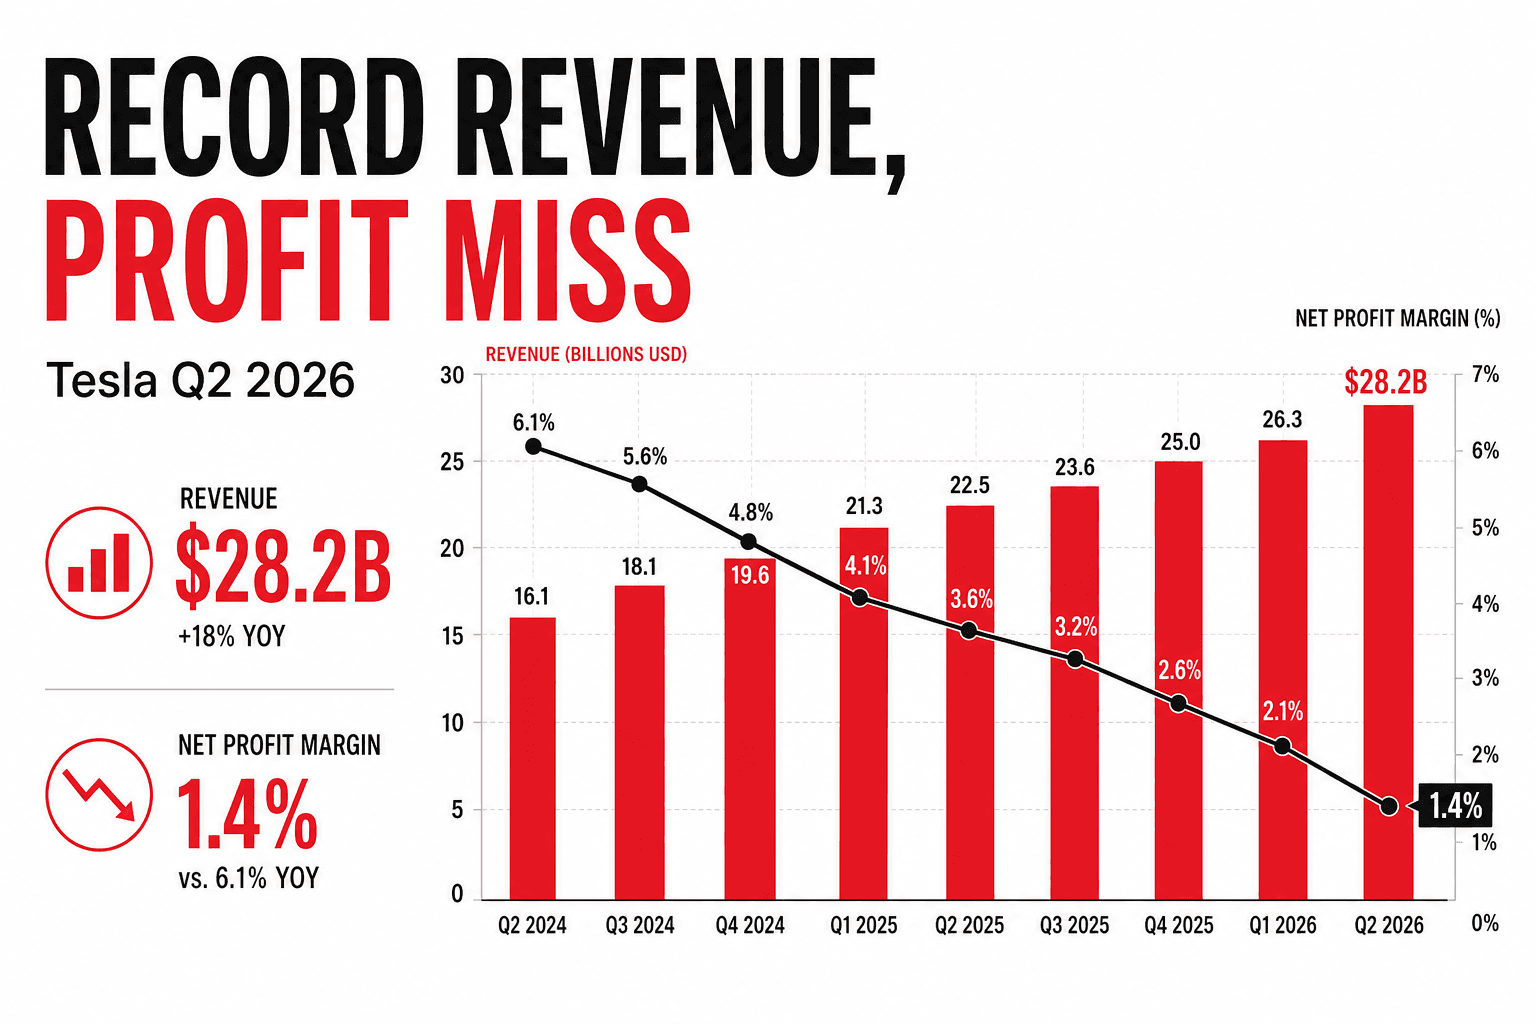
Tesla Q2 2026: Record Revenue, Big Profit Miss
Tesla posted record Q2 2026 revenue of $28.2B, but operating margin fell to 1.4%, adjusted EPS missed, and a capex surge turned free cash flow negative.
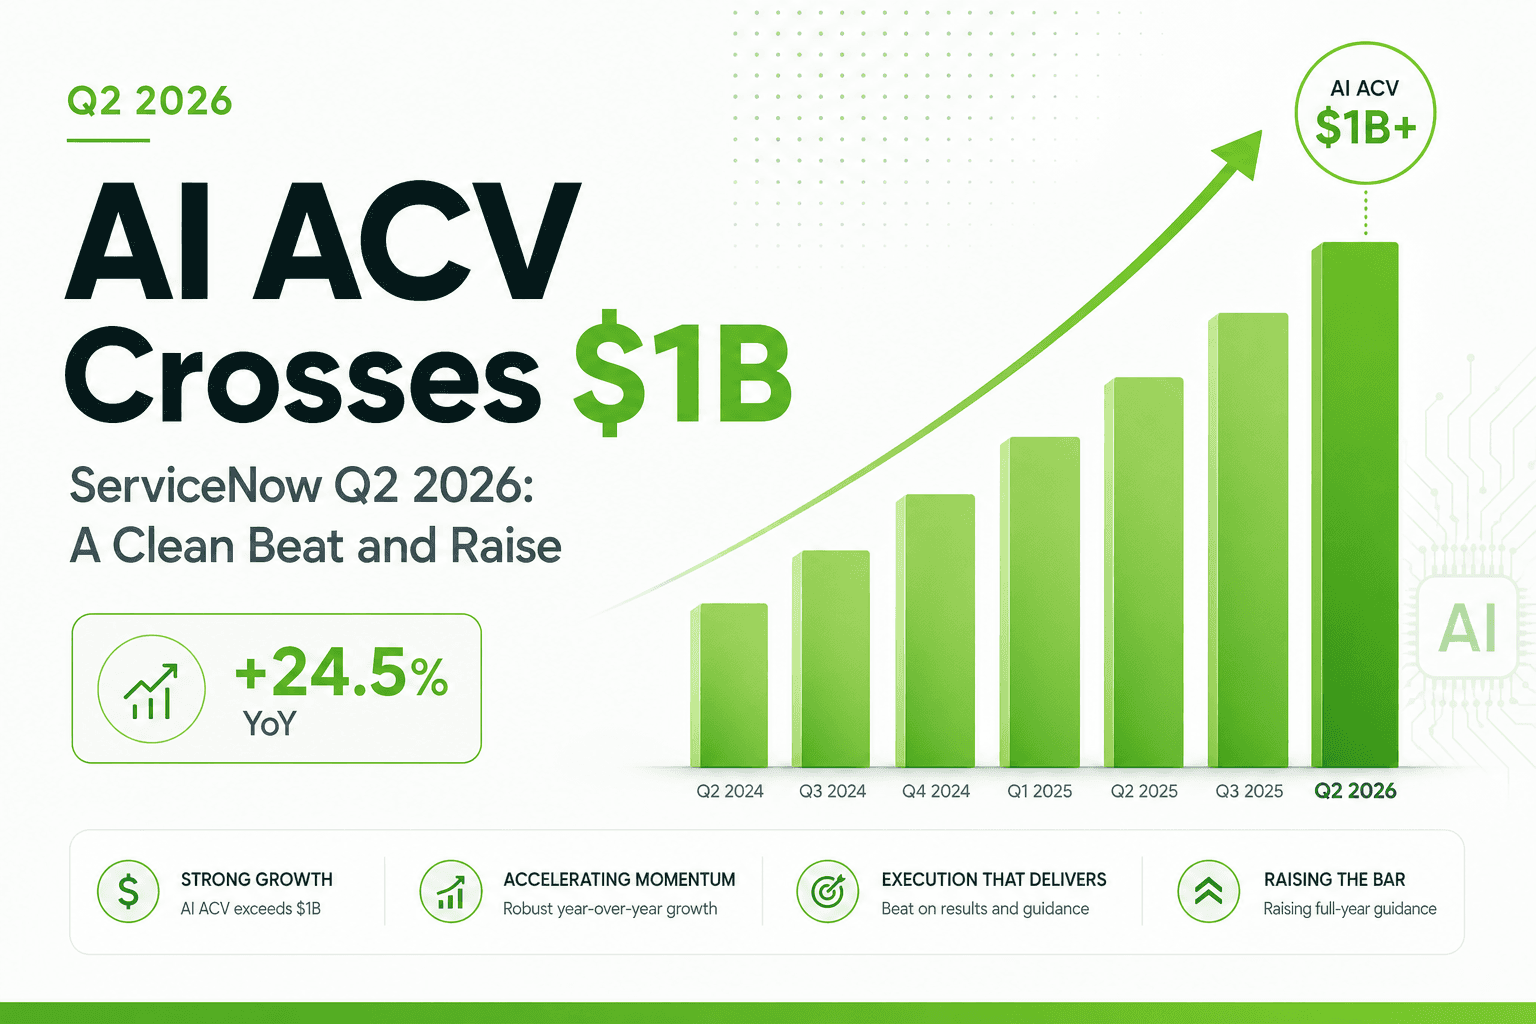
ServiceNow Q2 2026: AI ACV Crosses $1 Billion
ServiceNow's Q2 2026 was a clean beat-and-raise: subscription revenue grew 24.5% to $3.88B, ServiceNow AI ACV crossed $1 billion, and the FY26 outlook rose.
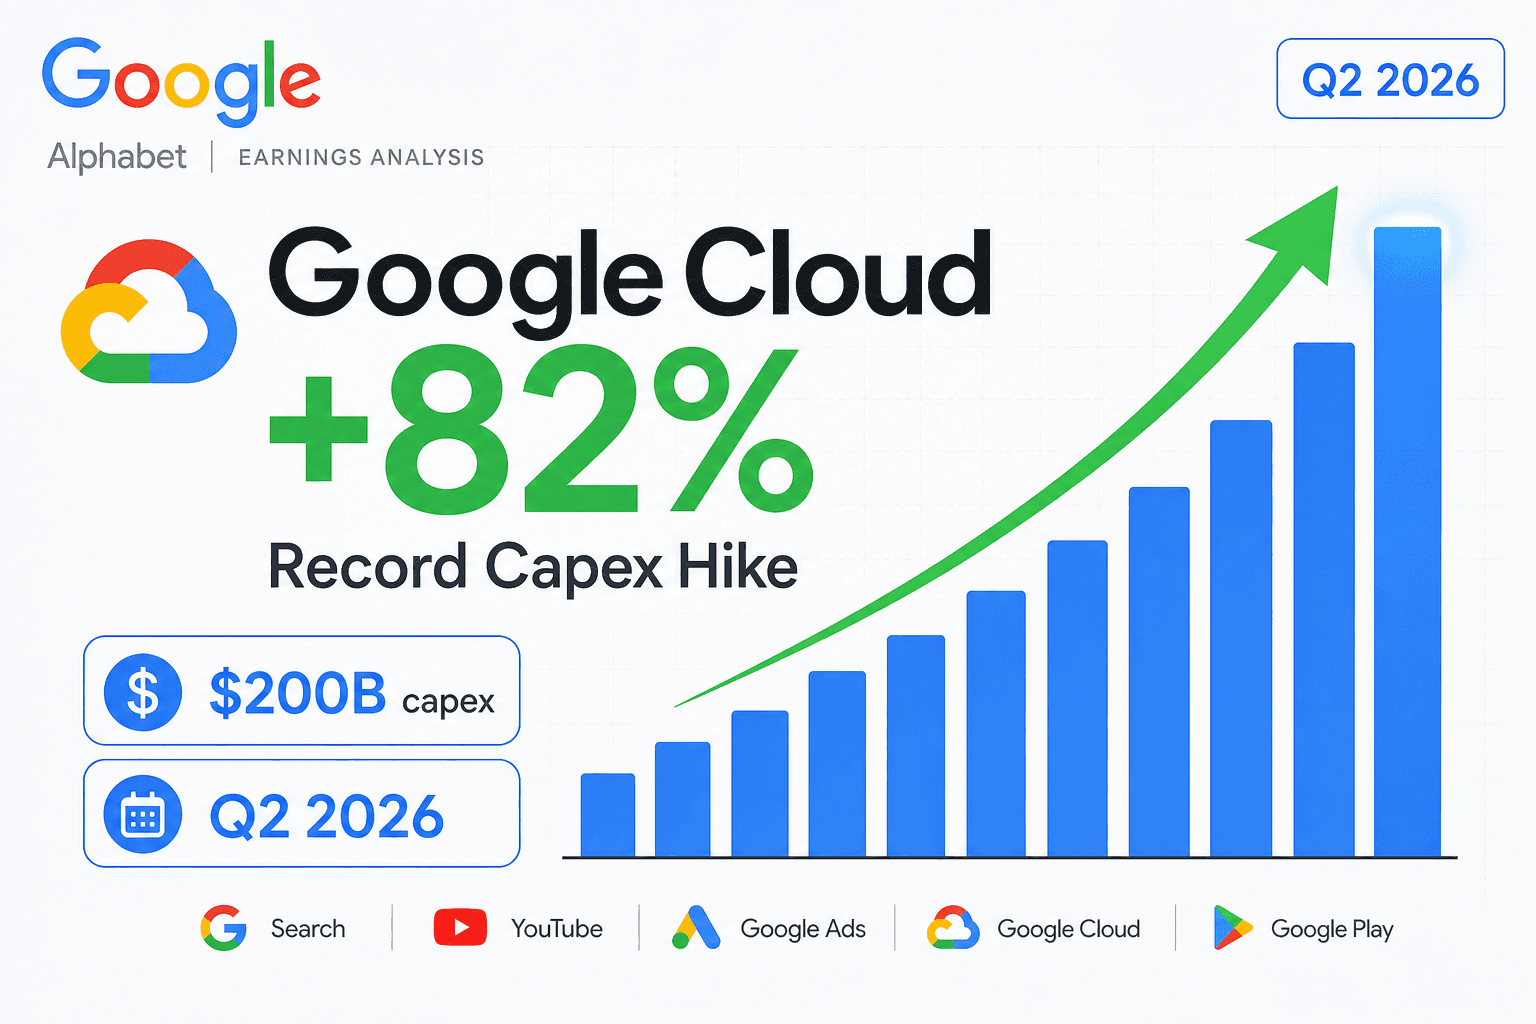
Alphabet Q2 2026: Cloud Soars 82%, Capex Hits Record
Alphabet's Q2 2026 revenue rose 24% to $119.8B and Google Cloud jumped 82%, but a record capex hike toward $200B and negative free cash flow sank the stock.
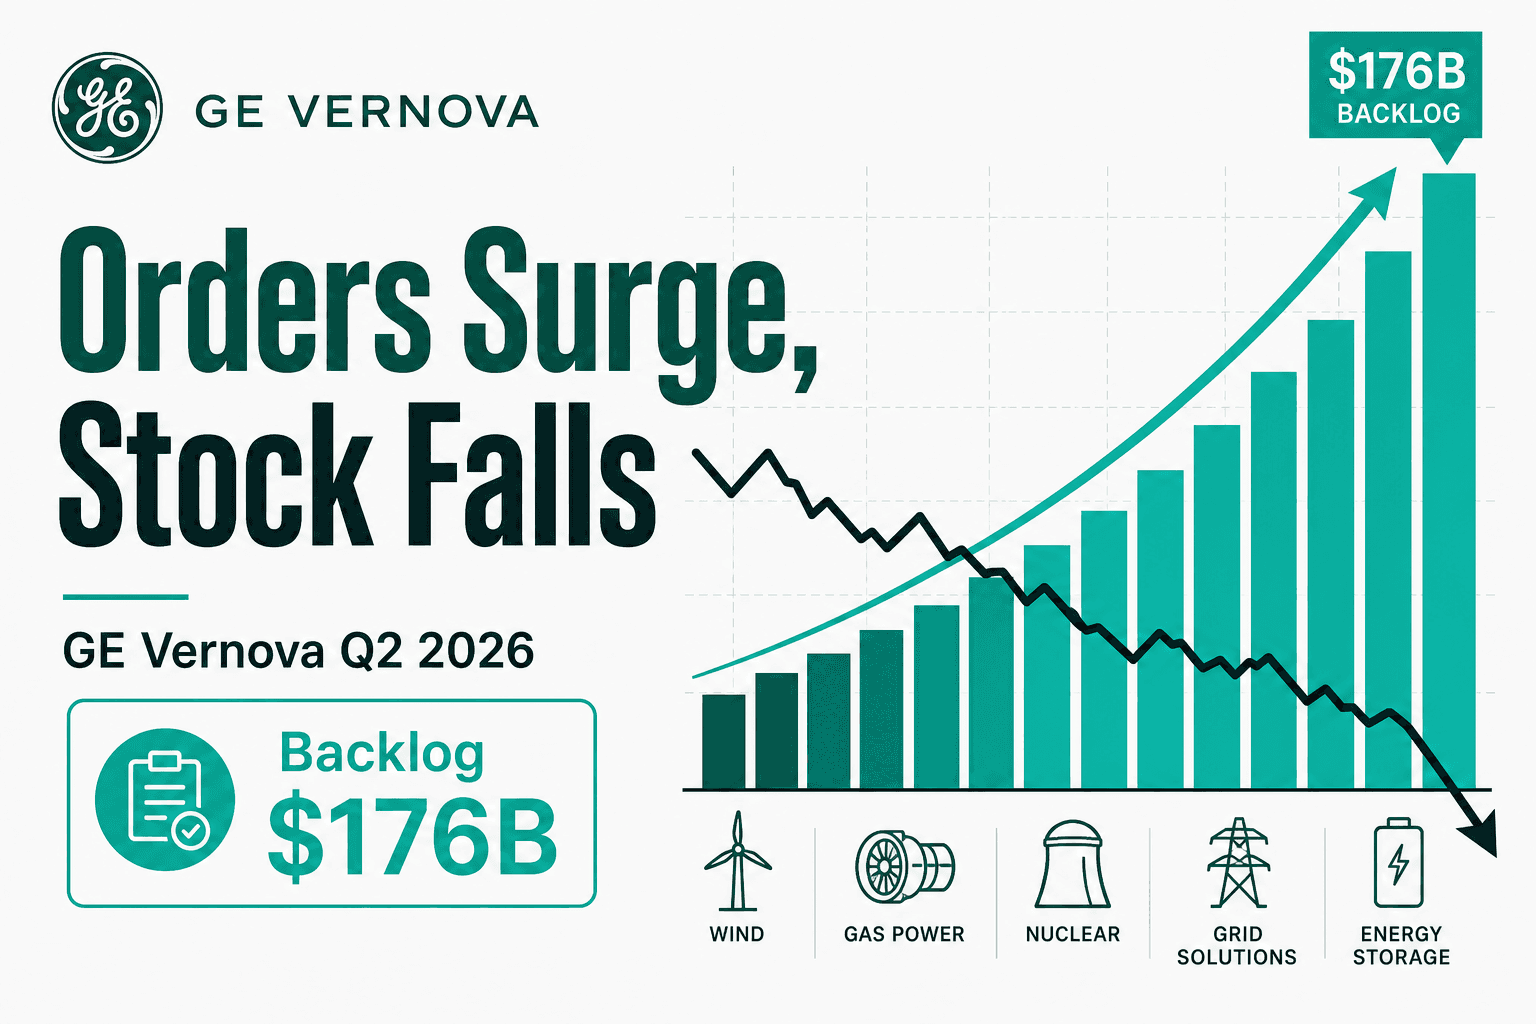
GE Vernova Q2 2026: Orders Surge, Stock Falls
GE Vernova beat on revenue and raised its 2026 guidance as orders jumped to a record $176B backlog, but a GAAP EPS miss and tariff caution sank the stock 8.7%.
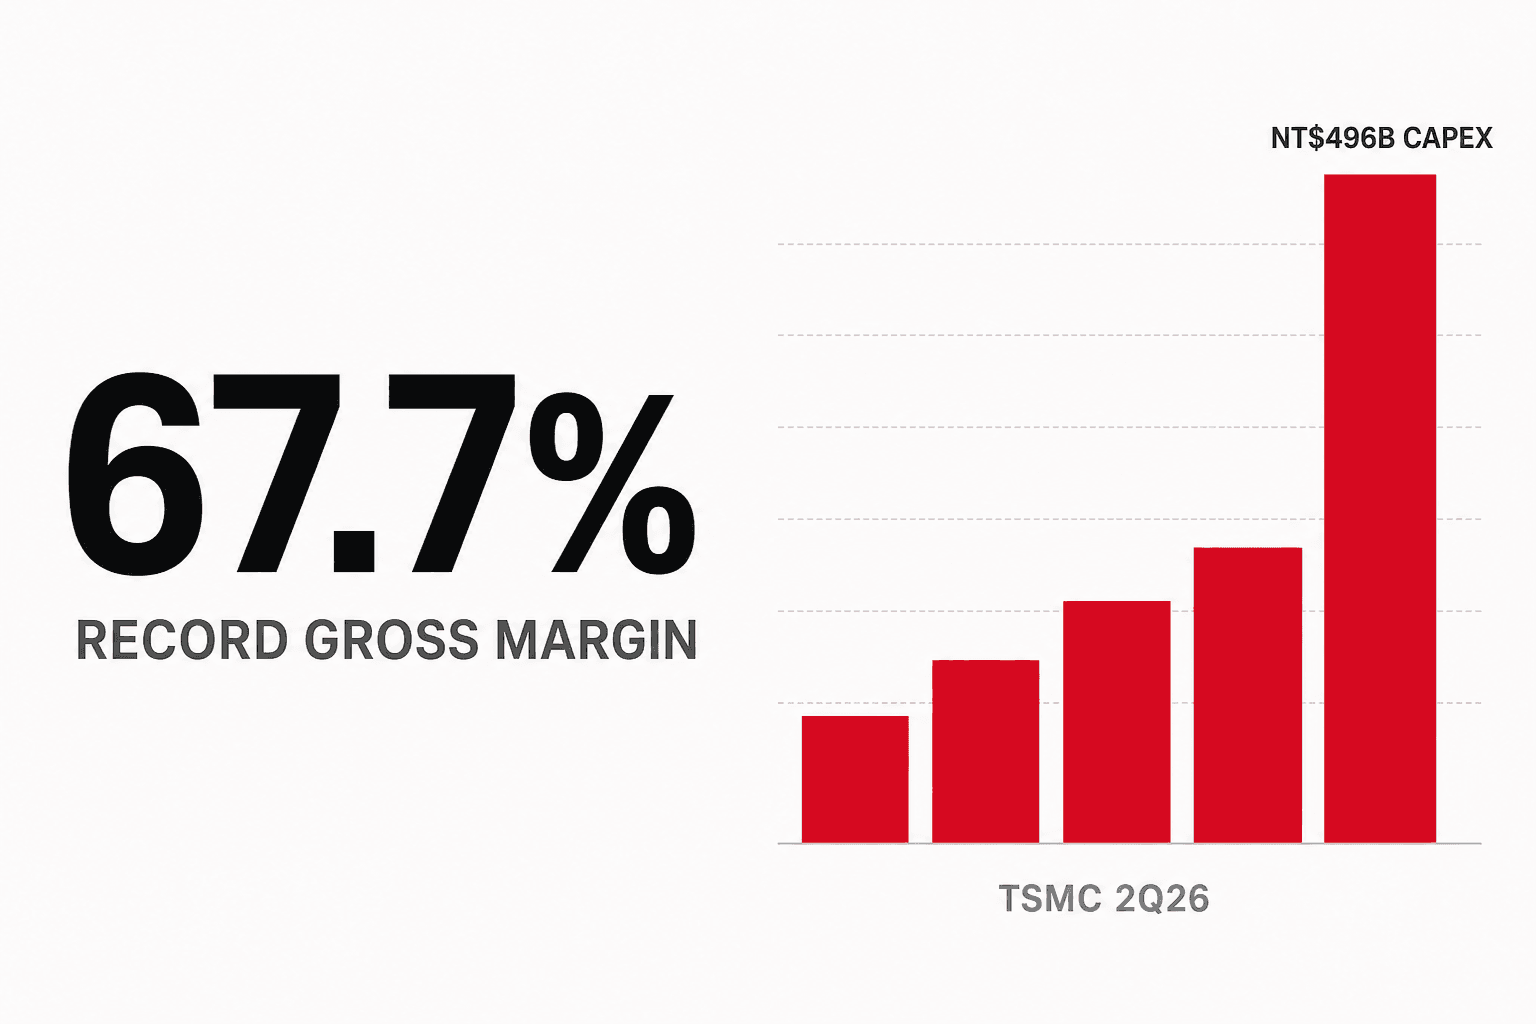
TSMC Q2 2026: Record Margins, Record CapEx, Record Selloff
TSMC broke records on revenue, gross margin, operating margin and EPS in Q2 2026, then guided margins lower, lifted CapEx to US$60–64B, and fell 7.29%.
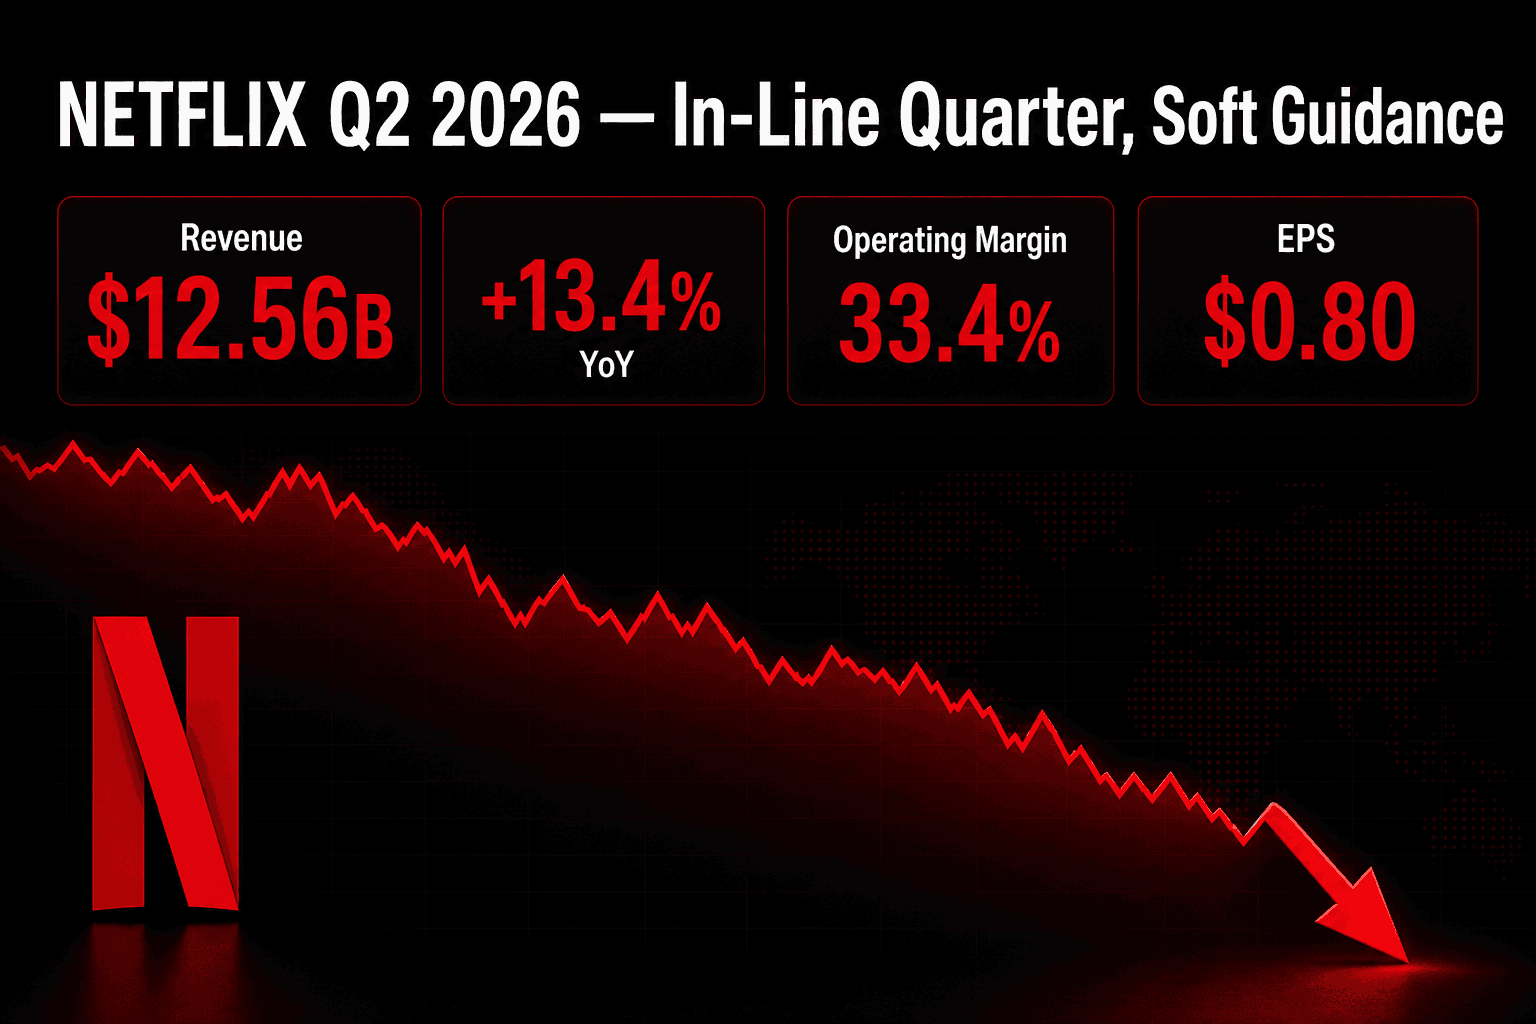
Netflix Q2 2026: Strong Margins, Soft Guide Sinks Stock
Netflix posted an in-line Q2 2026 with $12.56B revenue and a 33.4% operating margin, but a soft Q3 guide sent the stock to an 18-month low after hours.
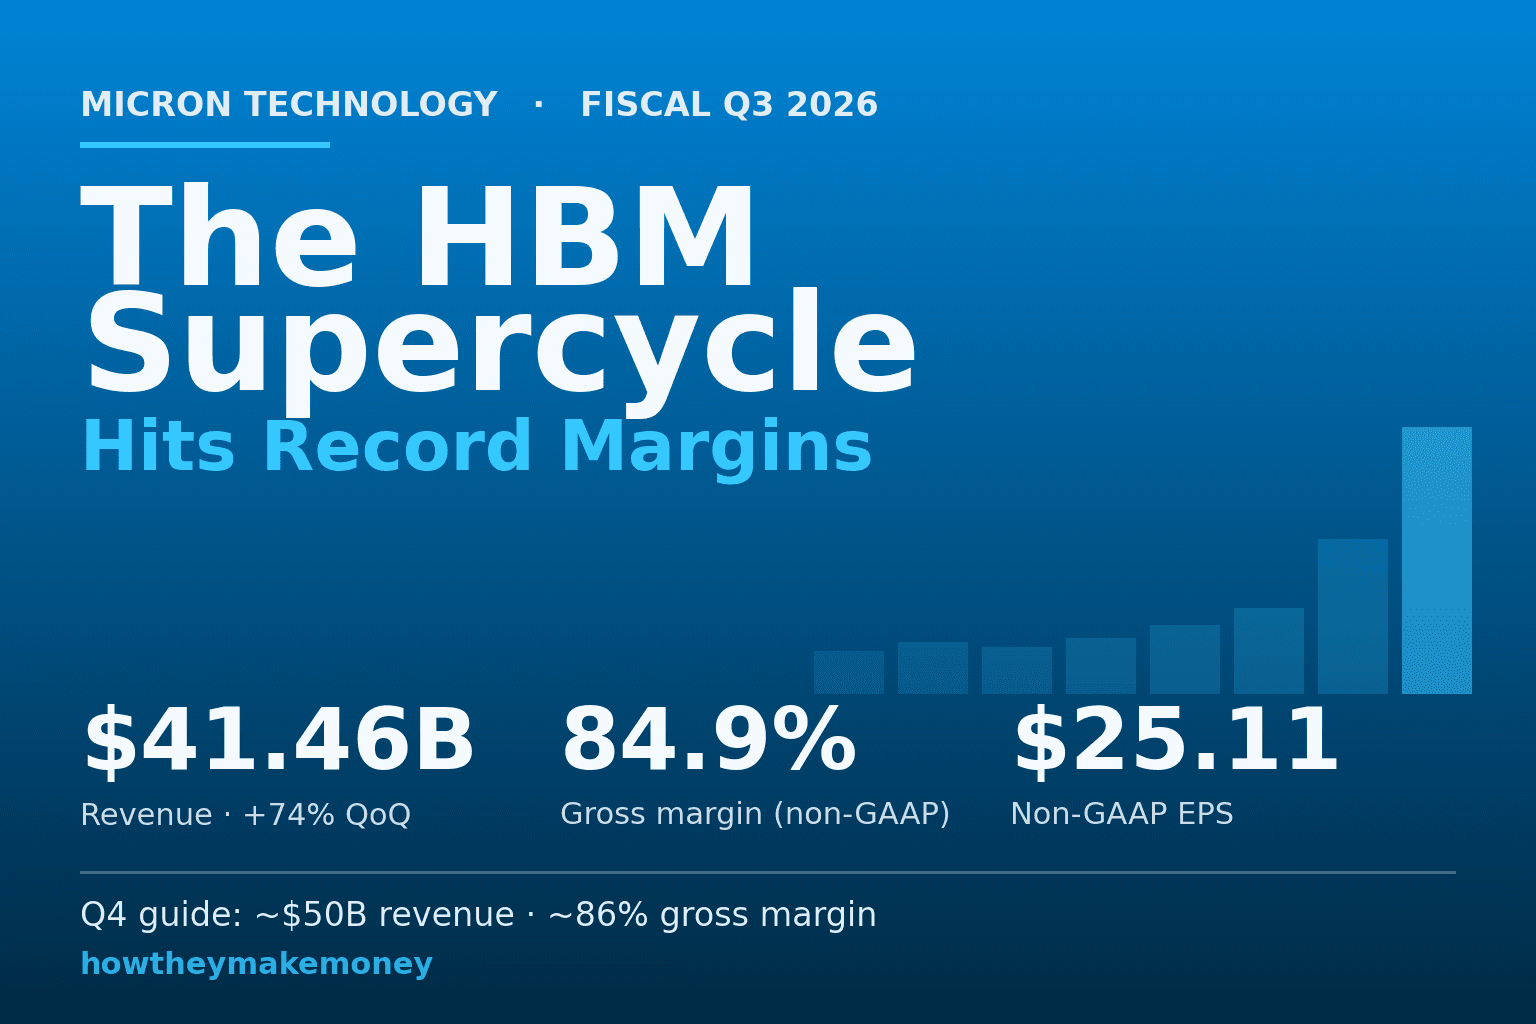
Micron FY26 Q3: HBM Supercycle, Record 85% Margin
Micron's fiscal Q3 2026 brought record revenue of $41.46B, an 85% gross margin, and a Q4 guide near $50B. Inside the AI memory shortage reshaping its economics.
Why We Built HowTheyMakeMoney — A Letter from Taiwan
Two developers in Taiwan built HowTheyMakeMoney to read earnings as charts. Two years on, AI lets us reinterpret financials faster and open Taiwan's market.
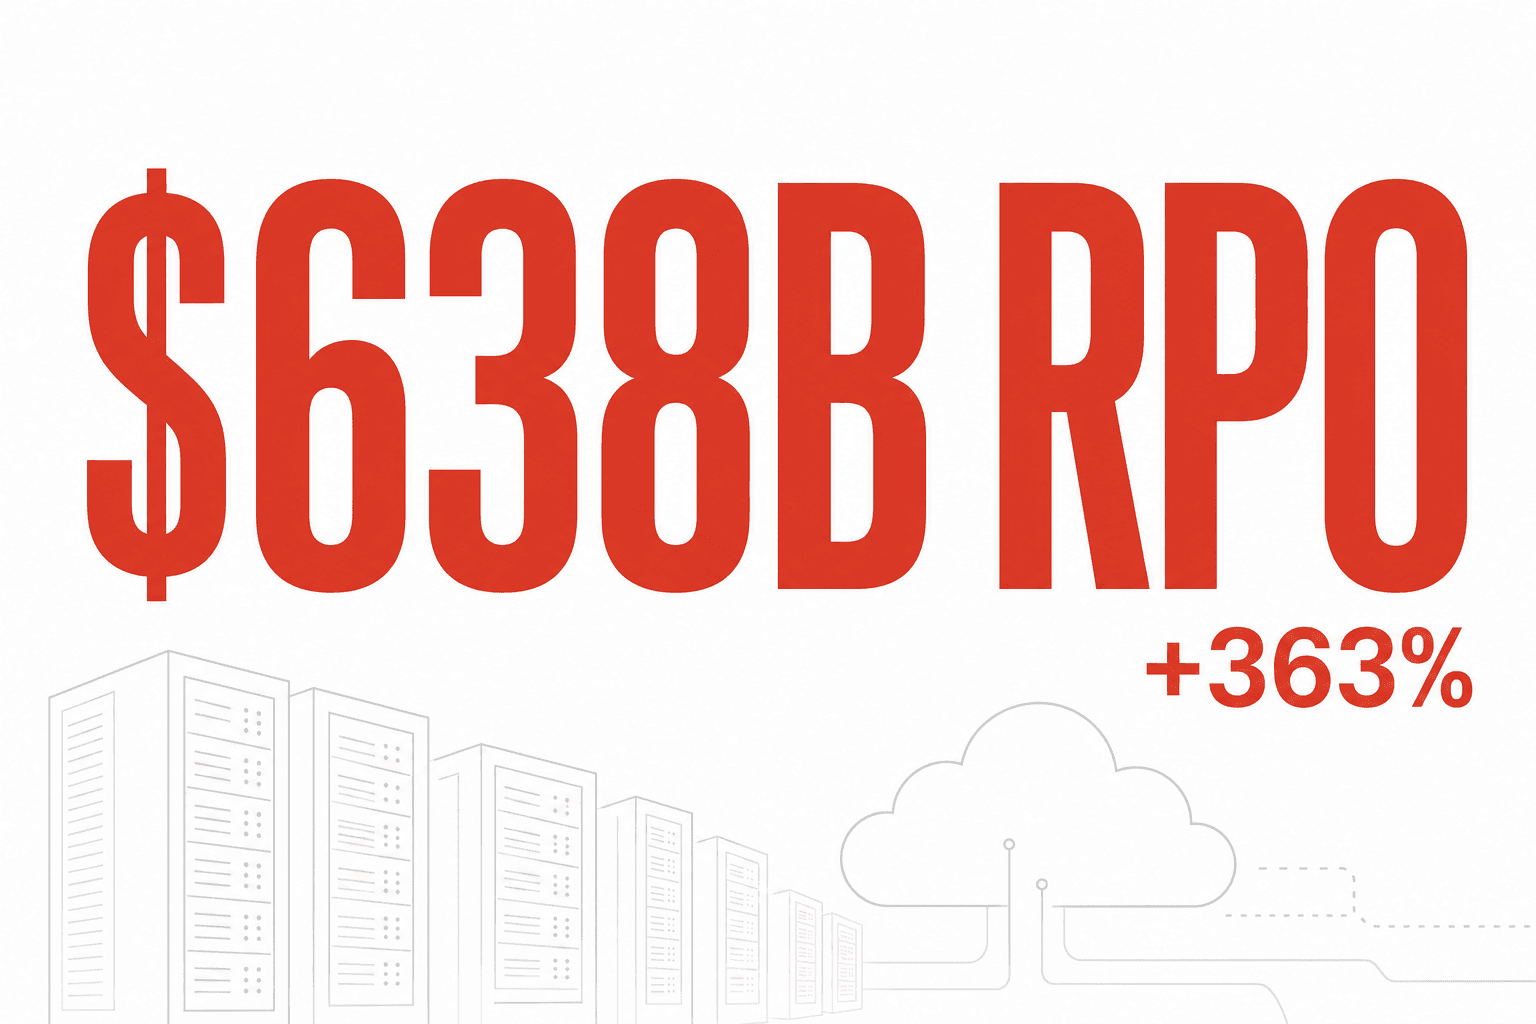
Oracle's $638B Backlog Soared 363%. Why Did the Stock Fall?
Oracle's Q4 FY26 was a record: RPO up 363% to $638B, OCI revenue +93%, MultiCloud database +404%. Yet free cash flow hit -$23.7B and the stock fell 8.5%.
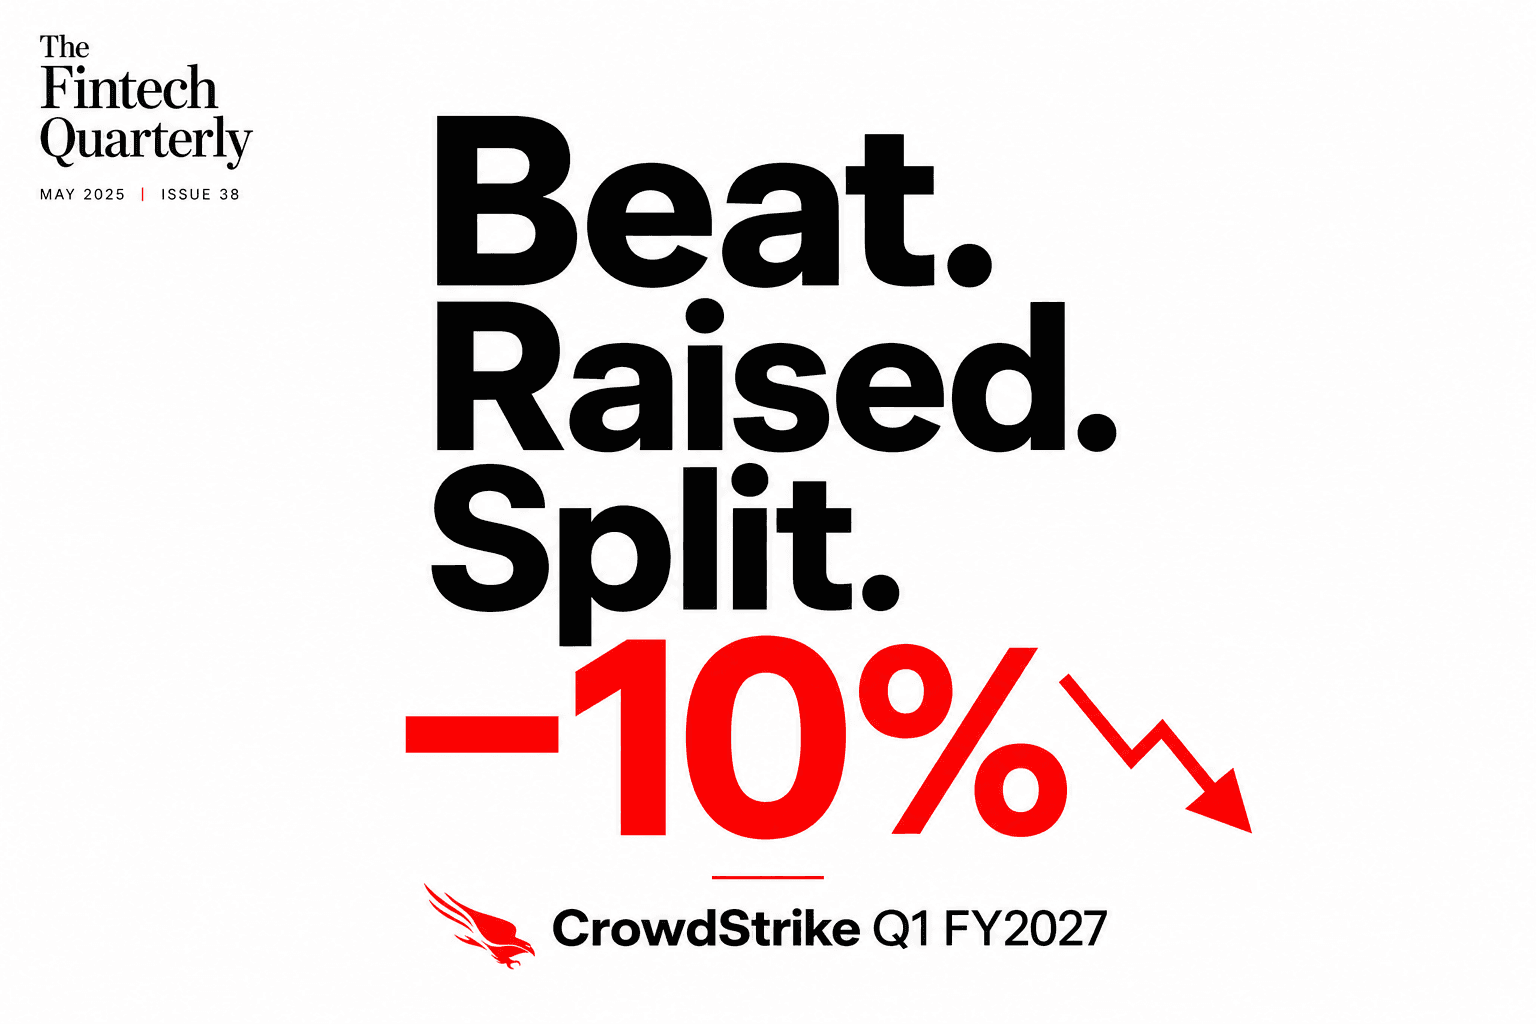
CrowdStrike Beat, Raised Guidance, and Split Its Stock 4-for-1 — and Still Fell 10%
CRWD Q1 FY27 beat on EPS ($1.10 vs $1.07) and revenue ($1.39B vs $1.36B), raised full-year net-new-ARR growth by 520 bps to 27.7%, posted record free cash flow, and announced a 4-for-1 split. The stock dropped ~10%. When the bar is perfection, a beat isn't enough.
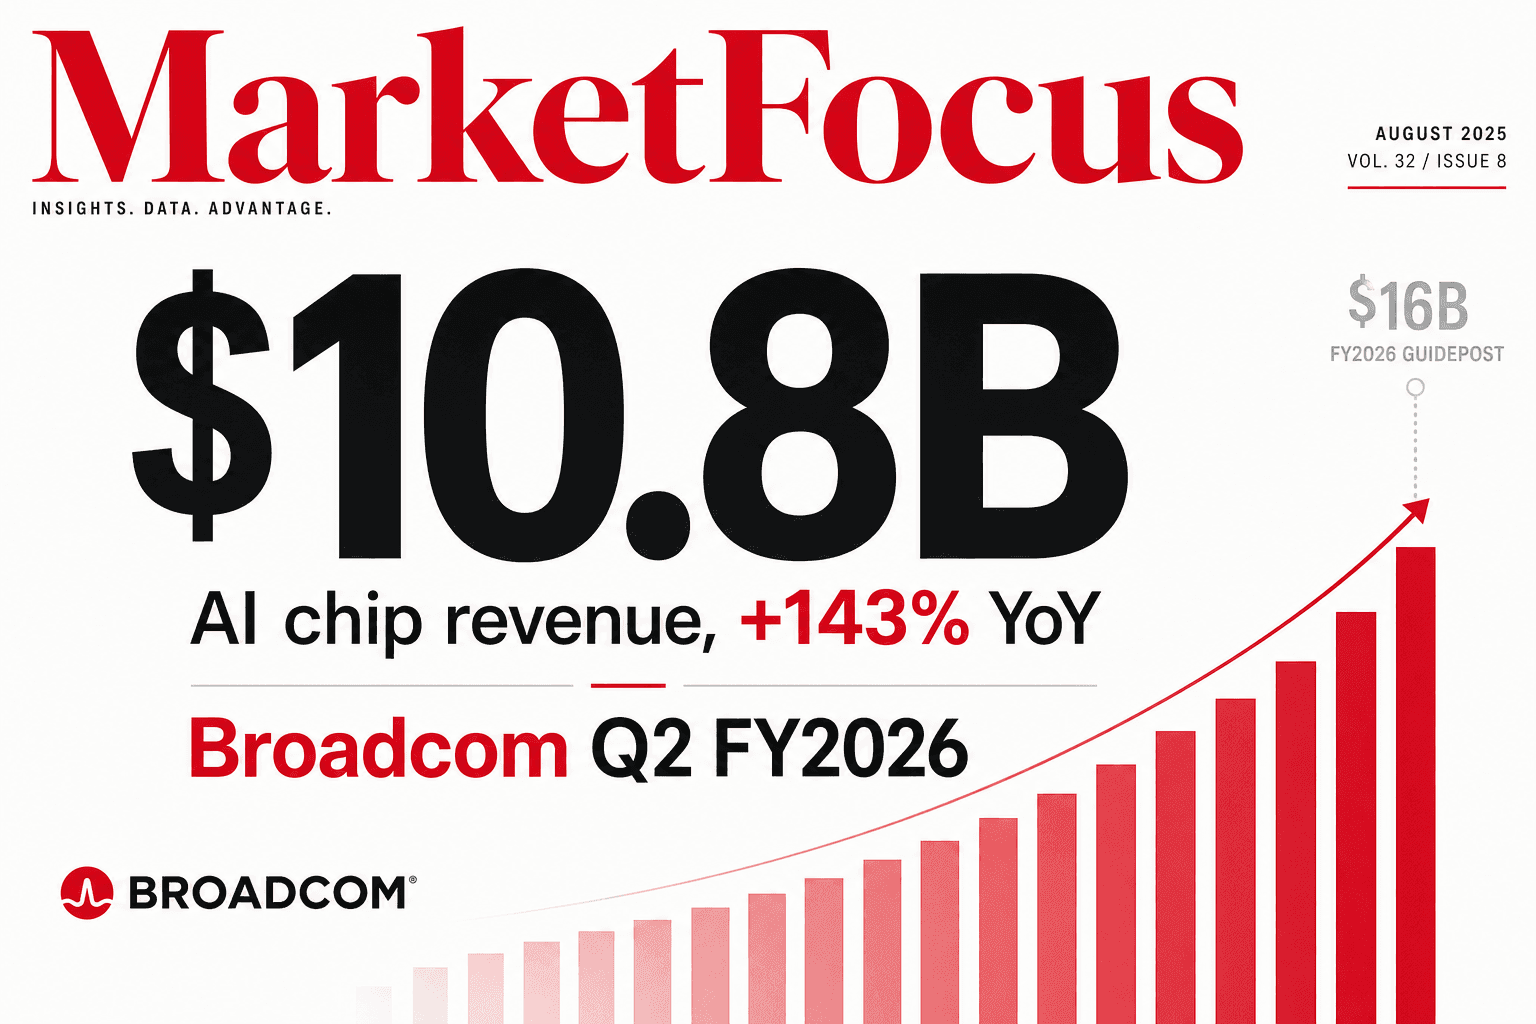
Broadcom's AI Chip Revenue Grew 143% to $10.8B and Guided Q3 to $16B — and the Stock Still Slipped
AVGO Q2 FY26 printed record revenue ($22.2B, +48% YoY), AI semiconductor revenue of $10.8B (+143% YoY), and a Q3 AI guide of $16.0B (+200% YoY). Non-GAAP EPS $2.44 beat. The stock dipped ~3% — because Hock Tan reaffirmed, but didn't raise, the $100B FY27 AI target.
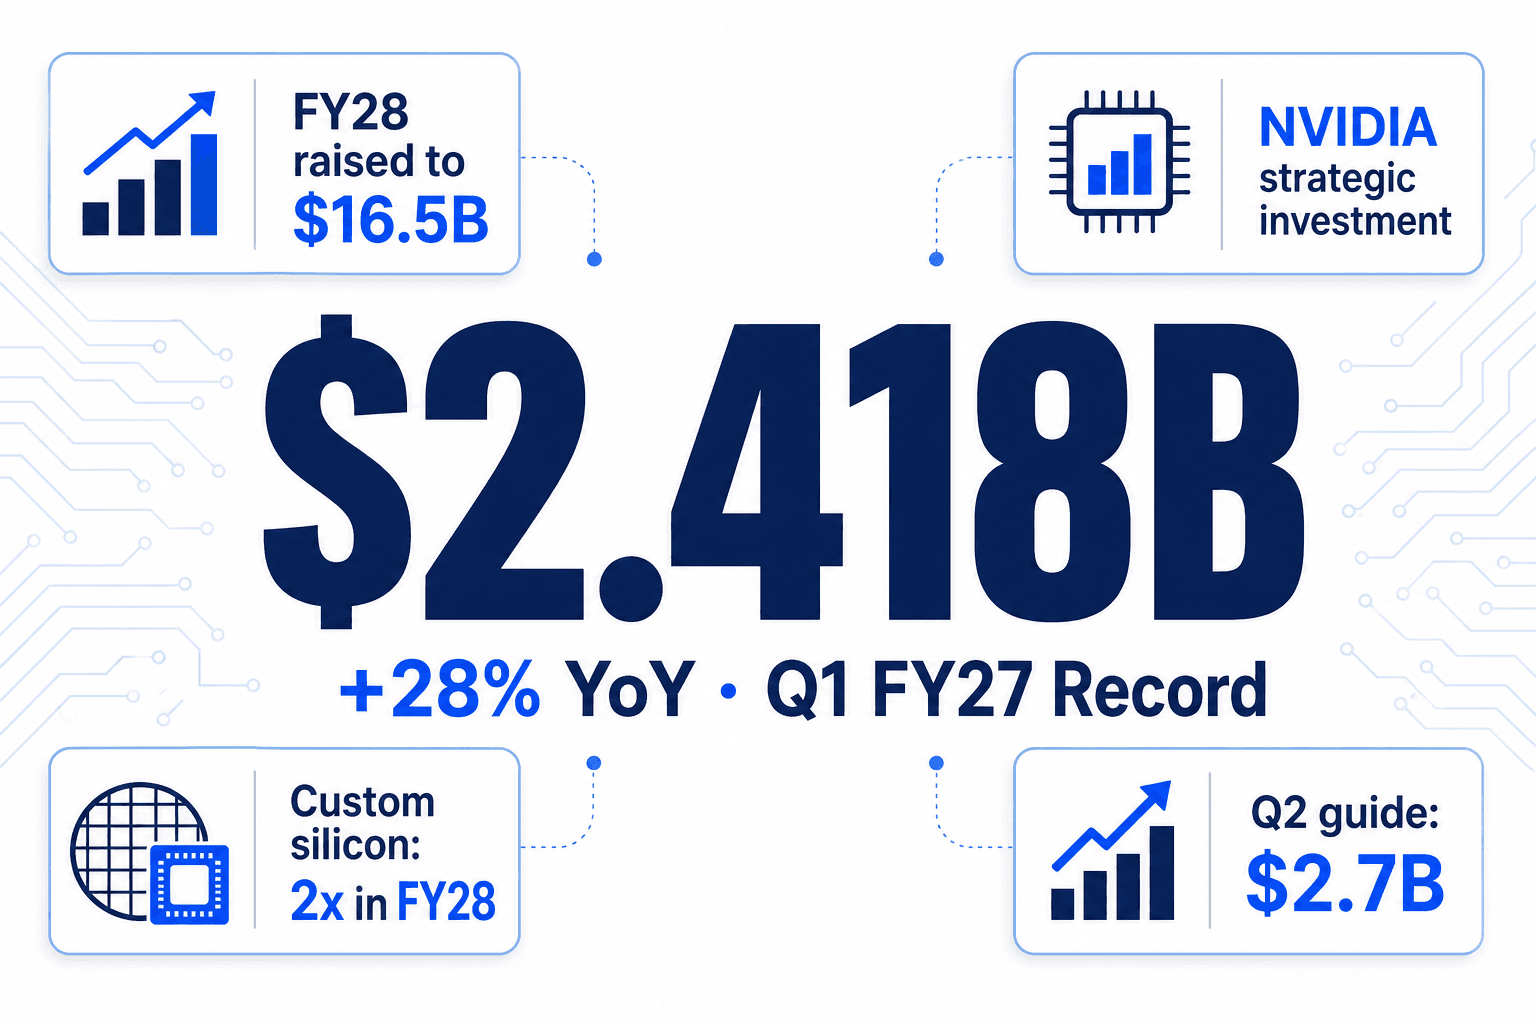
Marvell Q1 FY27: NVIDIA just bought a piece of the merchant silicon bridge
Marvell printed $2.418B revenue (+28% YoY), guided Q2 to $2.7B, hiked FY28 revenue to $16.5B, and disclosed a strategic equity investment from NVIDIA. The custom silicon thesis is no longer a debate.
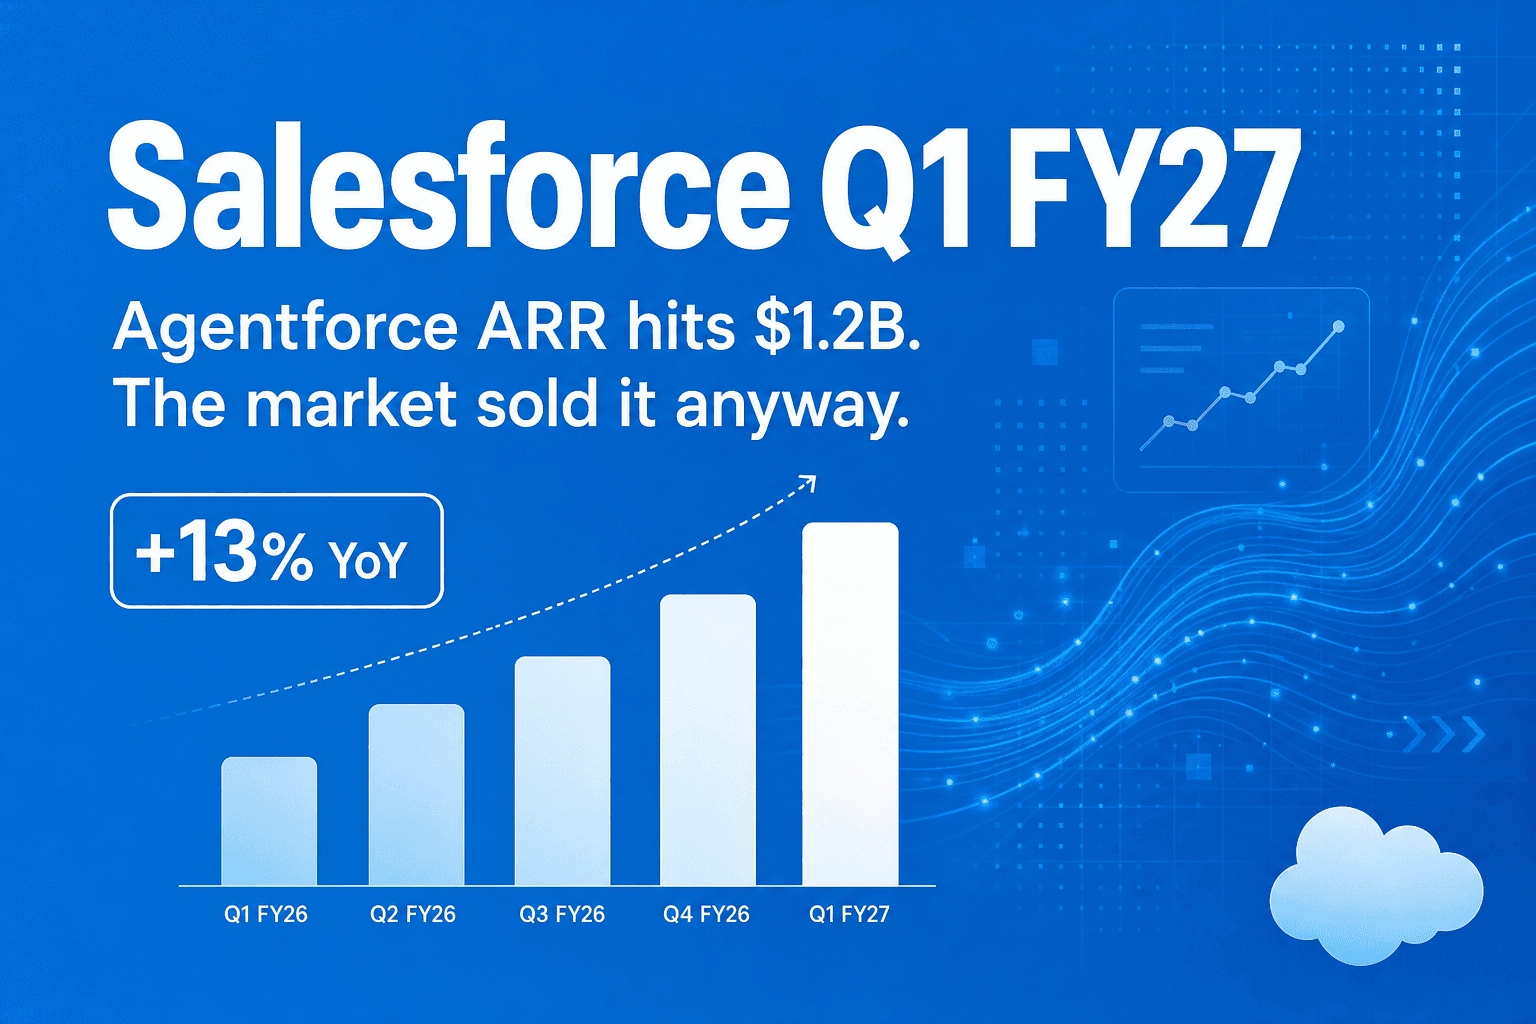
Salesforce Q1 FY27: Agentforce Hit $1.2B ARR. The Stock Fell Anyway.
Salesforce beat revenue by $70M, EPS by 24%, and pushed Agentforce ARR past $1.2B (+205% YoY). The stock sold off because Q2 revenue guide came in below consensus and the AI growth still isn't large enough to mask Tableau softness.
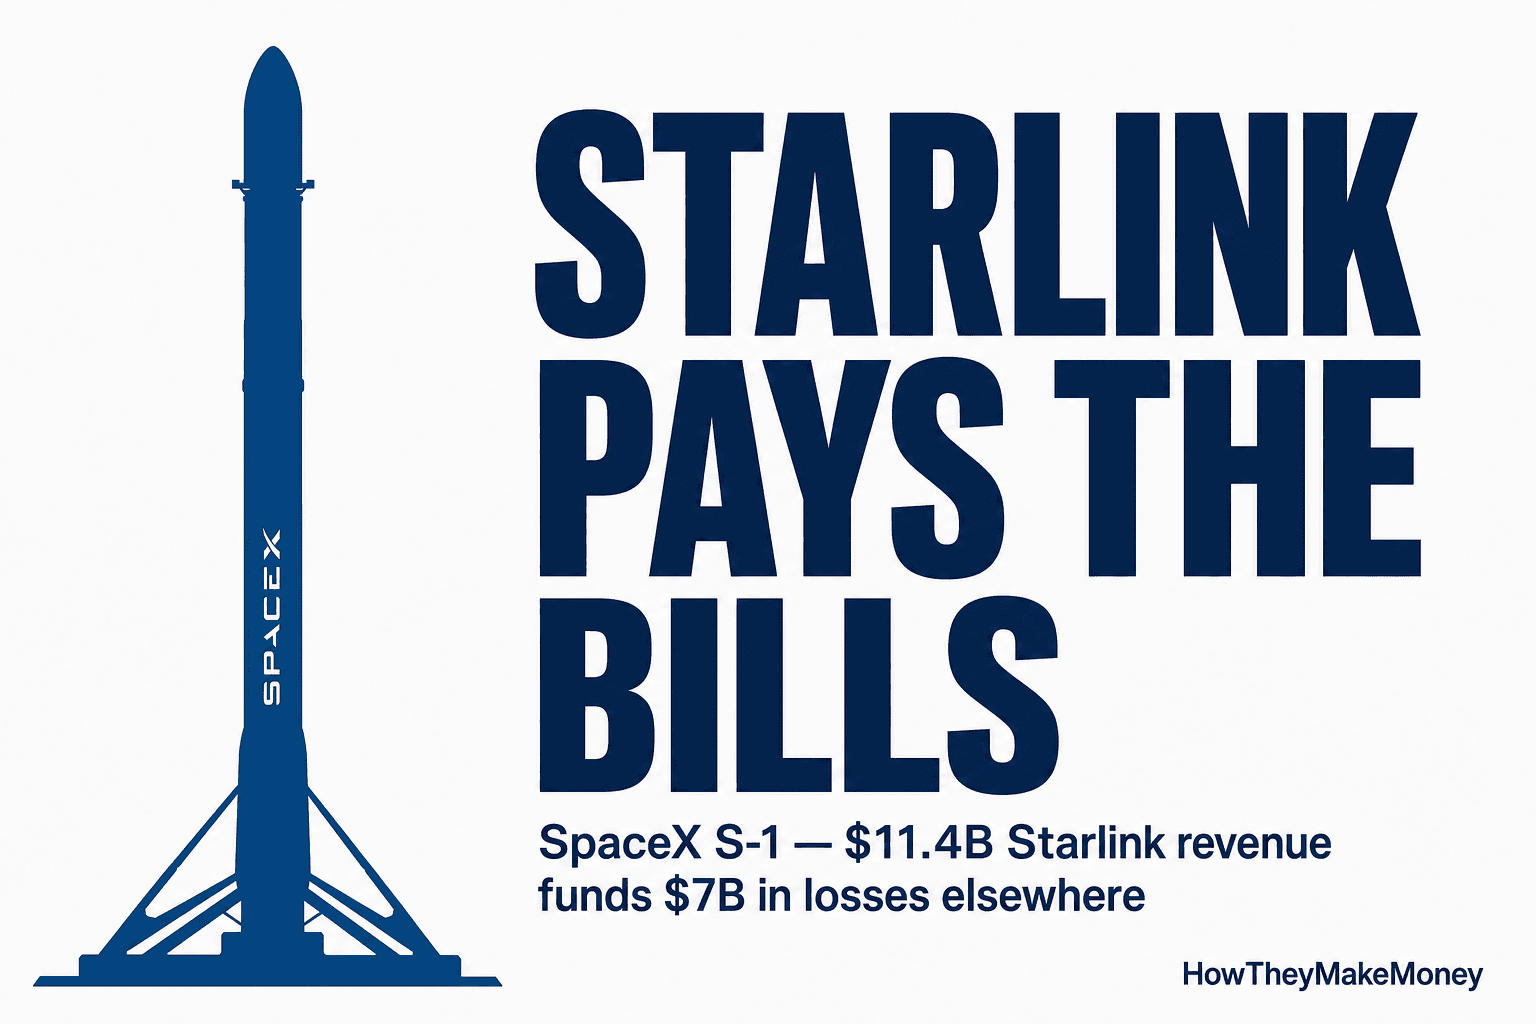
Starlink Pays the Bills: SpaceX's S-1 in One Segment Table
SpaceX's S-1, filed May 20, 2026, finally puts numbers on the open secret: Starlink is the only profitable segment. In FY2025, Connectivity threw off $4.4B in operating income while Space lost $657M and AI lost $6.4B — a $7B drag absorbed almost entirely by the broadband business. The launch company is funded by the internet company. AI eats 61% of the capex.
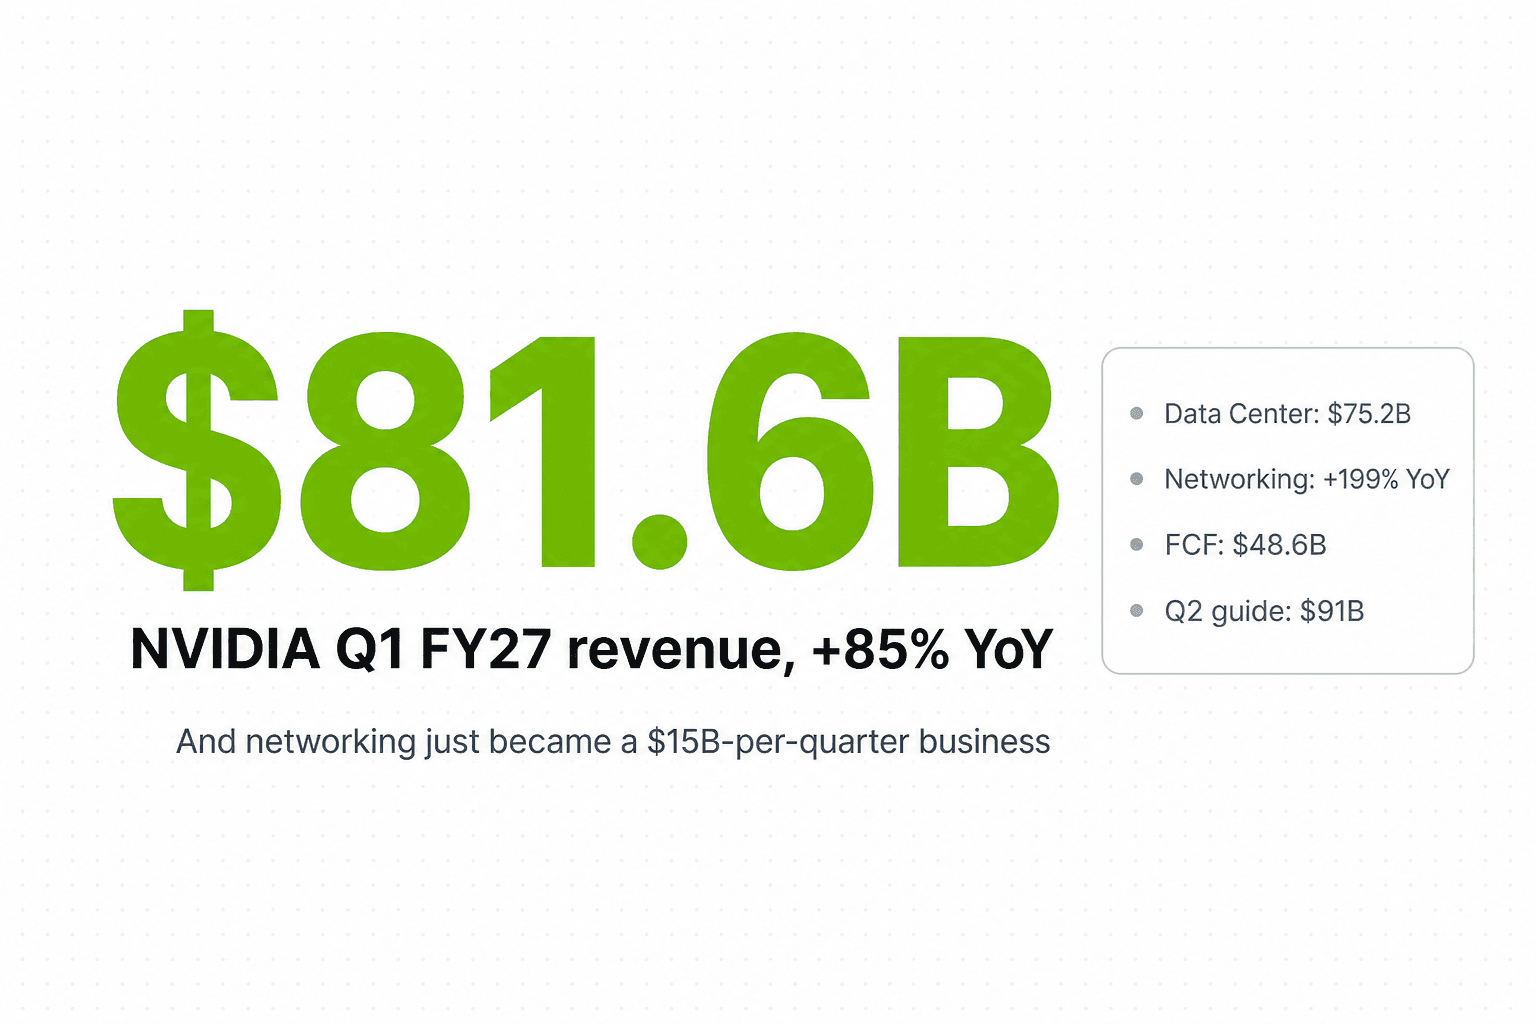
NVIDIA Q1 FY27: networking just became a $15B-per-quarter business
NVIDIA printed $81.6B in revenue (+85% YoY), guided Q2 to $91B (+$4–6B above Street), hiked its dividend 25× and added $80B to the buyback. The understated number: networking +199% YoY to $14.8B — now 20% of Data Center.
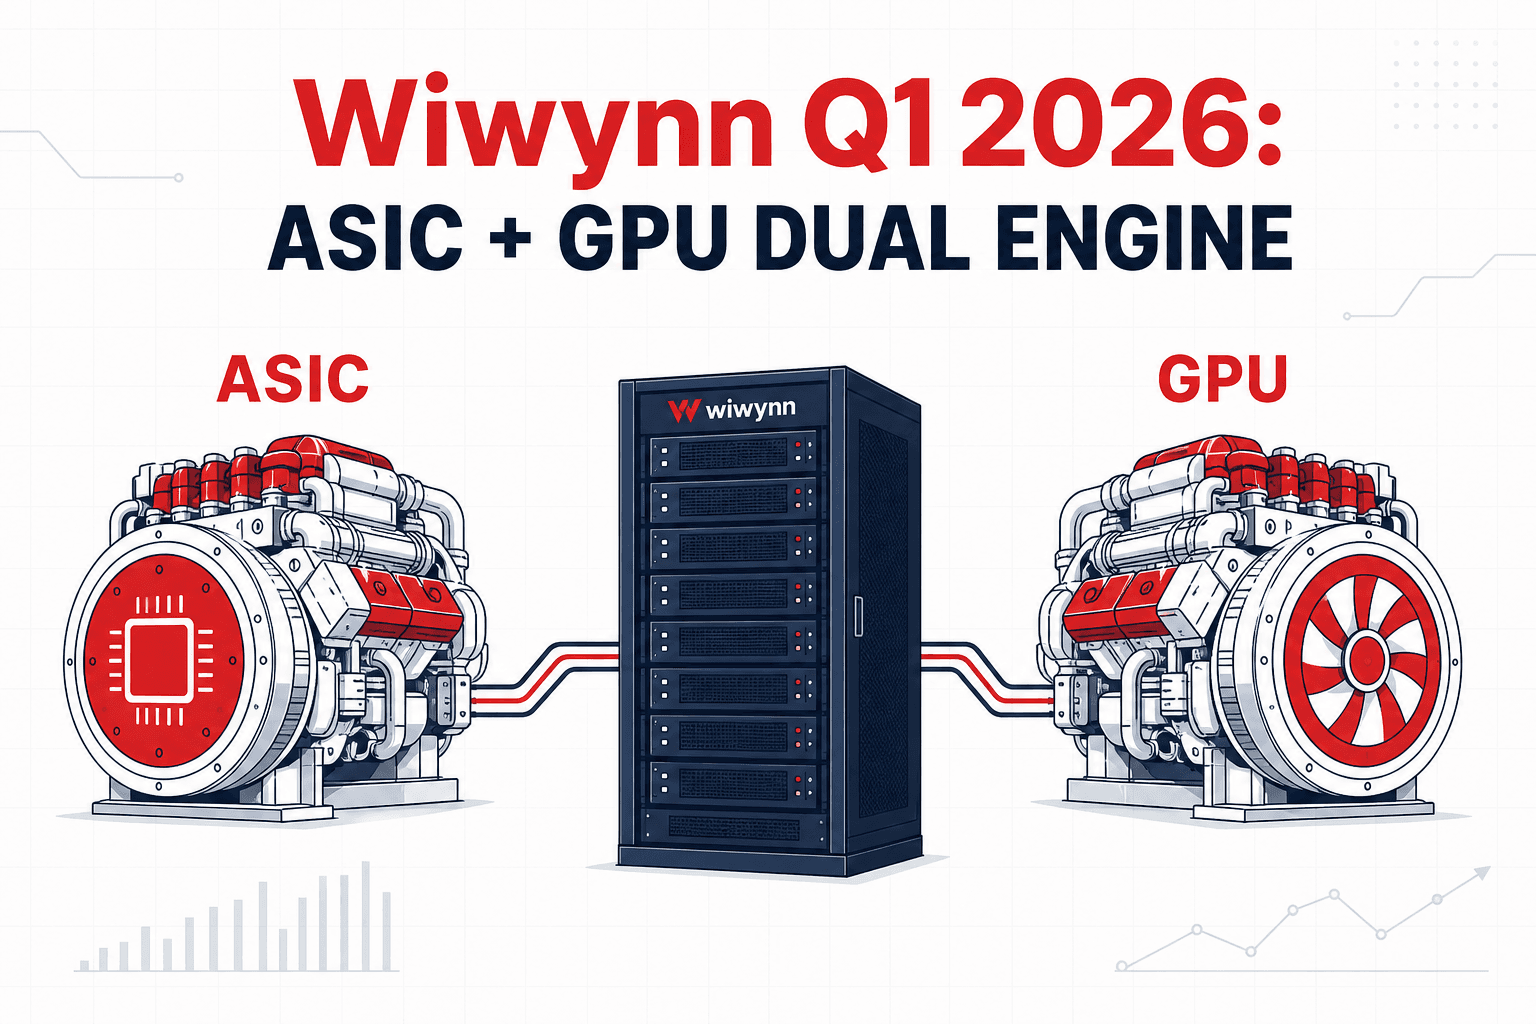
Wiwynn Q1 2026: Gross Margin Inflects After Eight Quarters Down, ASIC + GPU Dual Engine Takes Shape
Wiwynn (6669.TW) 1Q26 revenue NT$276.5B (+62% YoY), EPS NT$75.95 — all-time Q1 high. GM inflects +32bps QoQ, AI mix holds above 50%, GS upgrades to Top Pick.
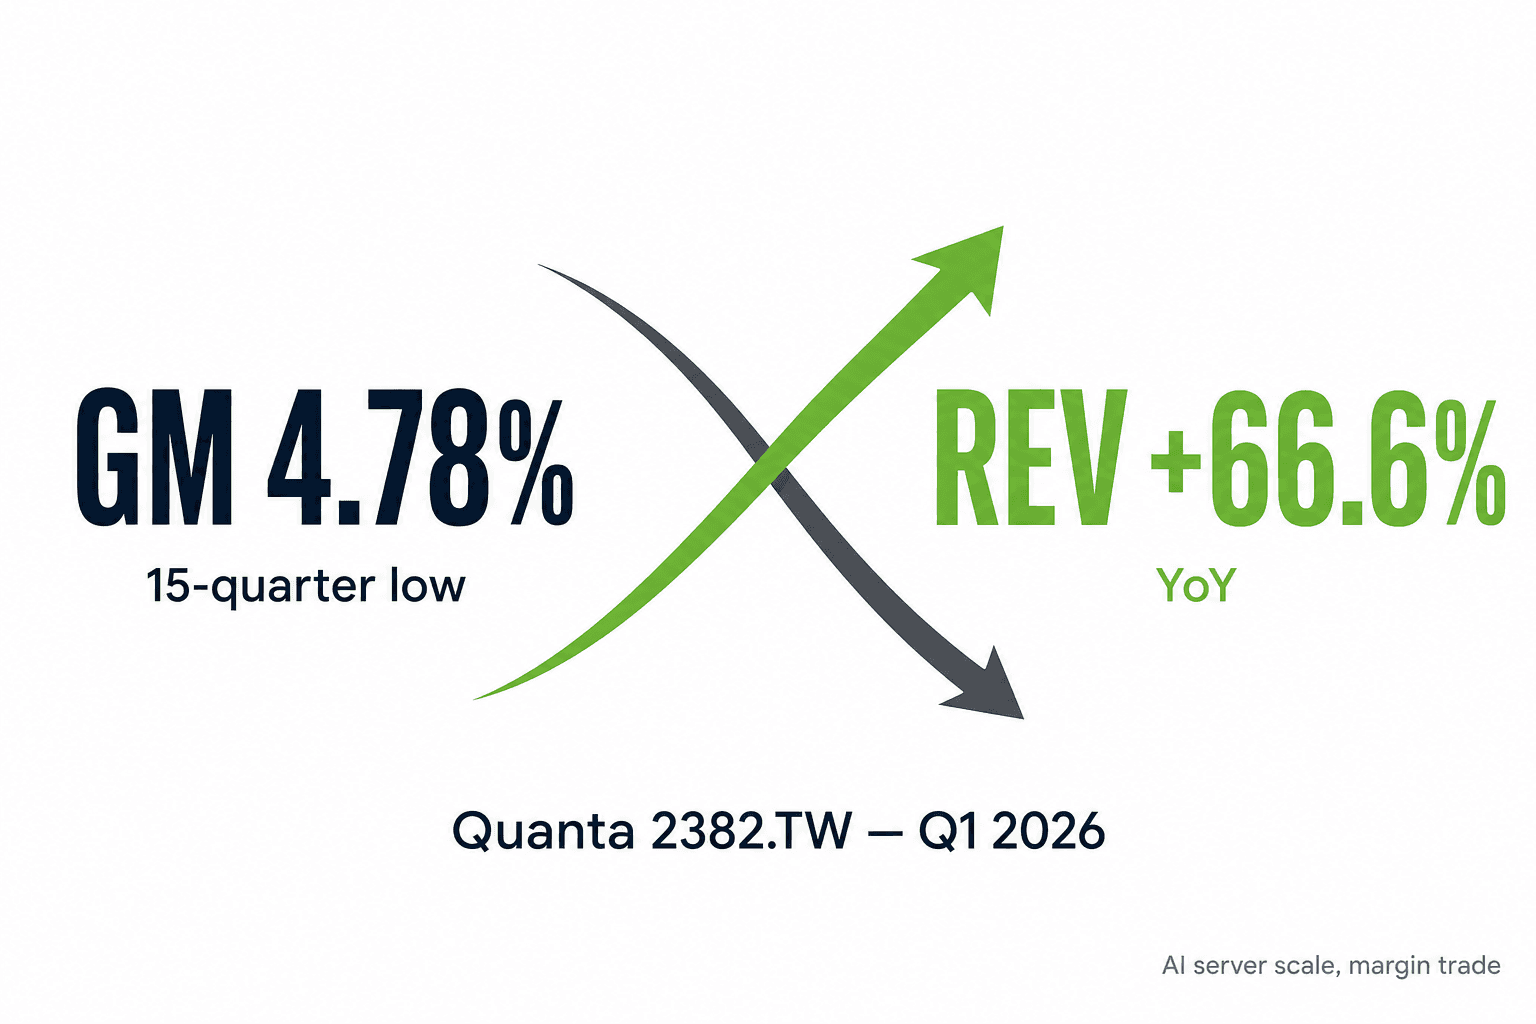
Quanta Q1 2026: Record NT$809B Revenue, Gross Margin to a 15-Quarter Low
Quanta (2382.TW) Q1 2026 revenue hit NT$809.2B (+66.6% YoY, +26.7% QoQ) — a single-quarter record since listing. EPS NT$5.50 was a Q1 record. Gross margin? 4.78%, the lowest in 15 quarters. This is what an AI-server-scale-for-margin trade looks like in print.
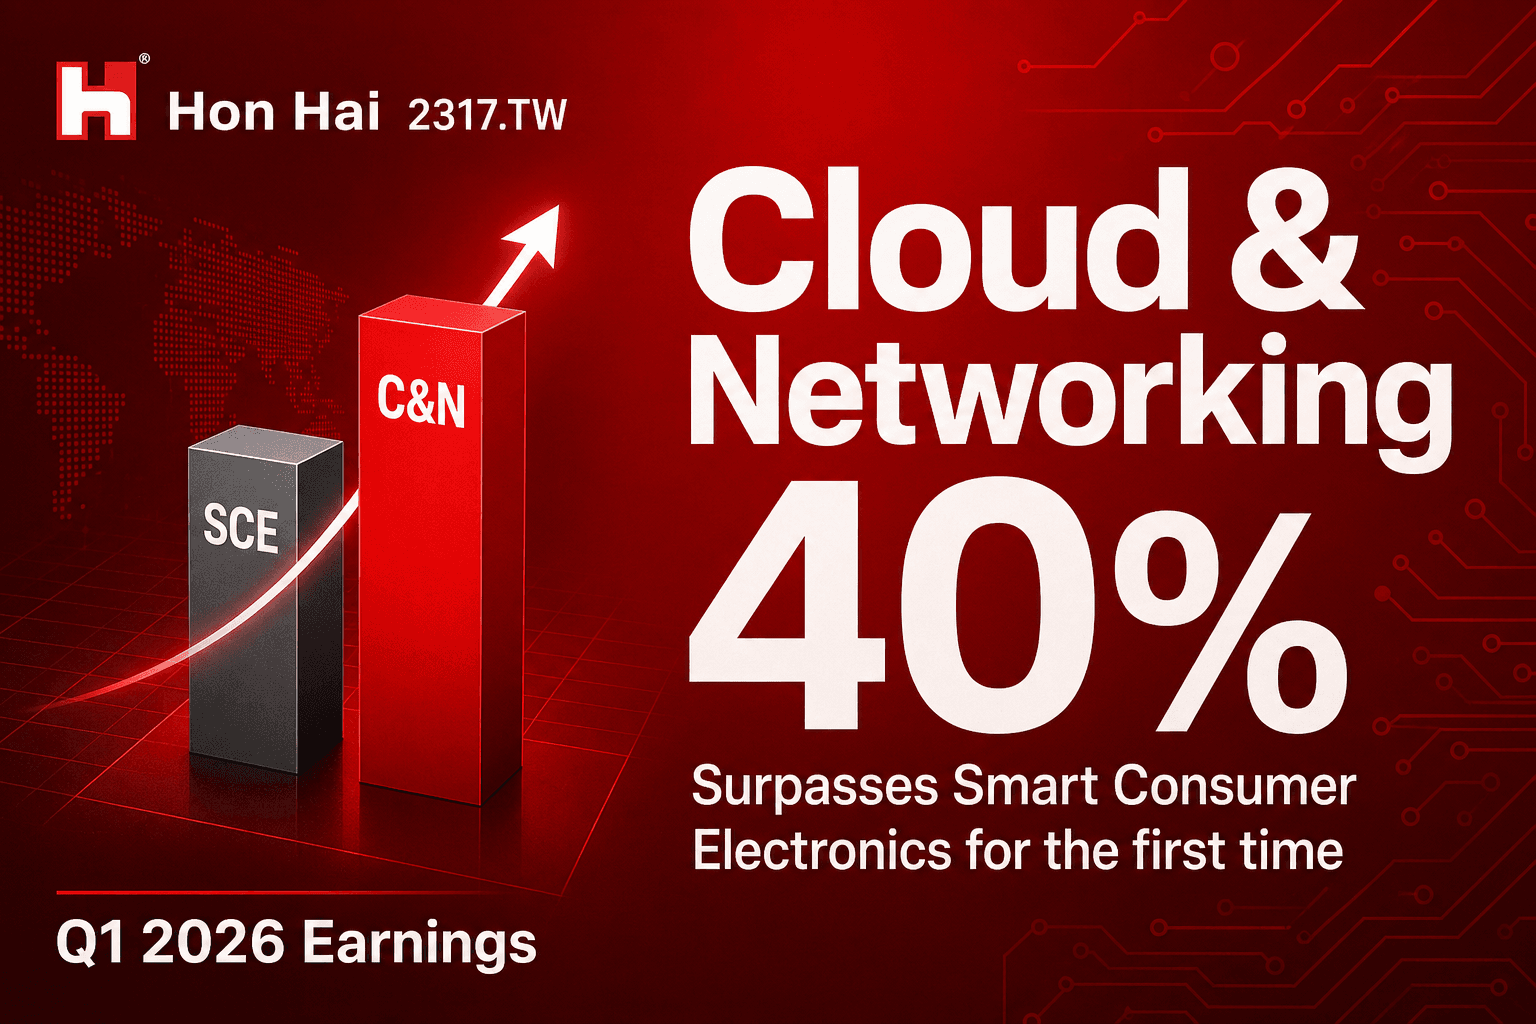
Hon Hai Q1 2026: Operating Profit Jumps 63% YoY, Cloud & Networking Hits 40% — Bigger Than iPhone for the First Time
Hon Hai (2317.TW) Q1 2026 revenue NT$2.13T (+29.68% YoY), operating profit NT$75.65B (+63% YoY). Cloud & Networking Products jumped to 40% of revenue, surpassing Smart Consumer Electronics (38%) for the first time. AI server is officially the main business now.
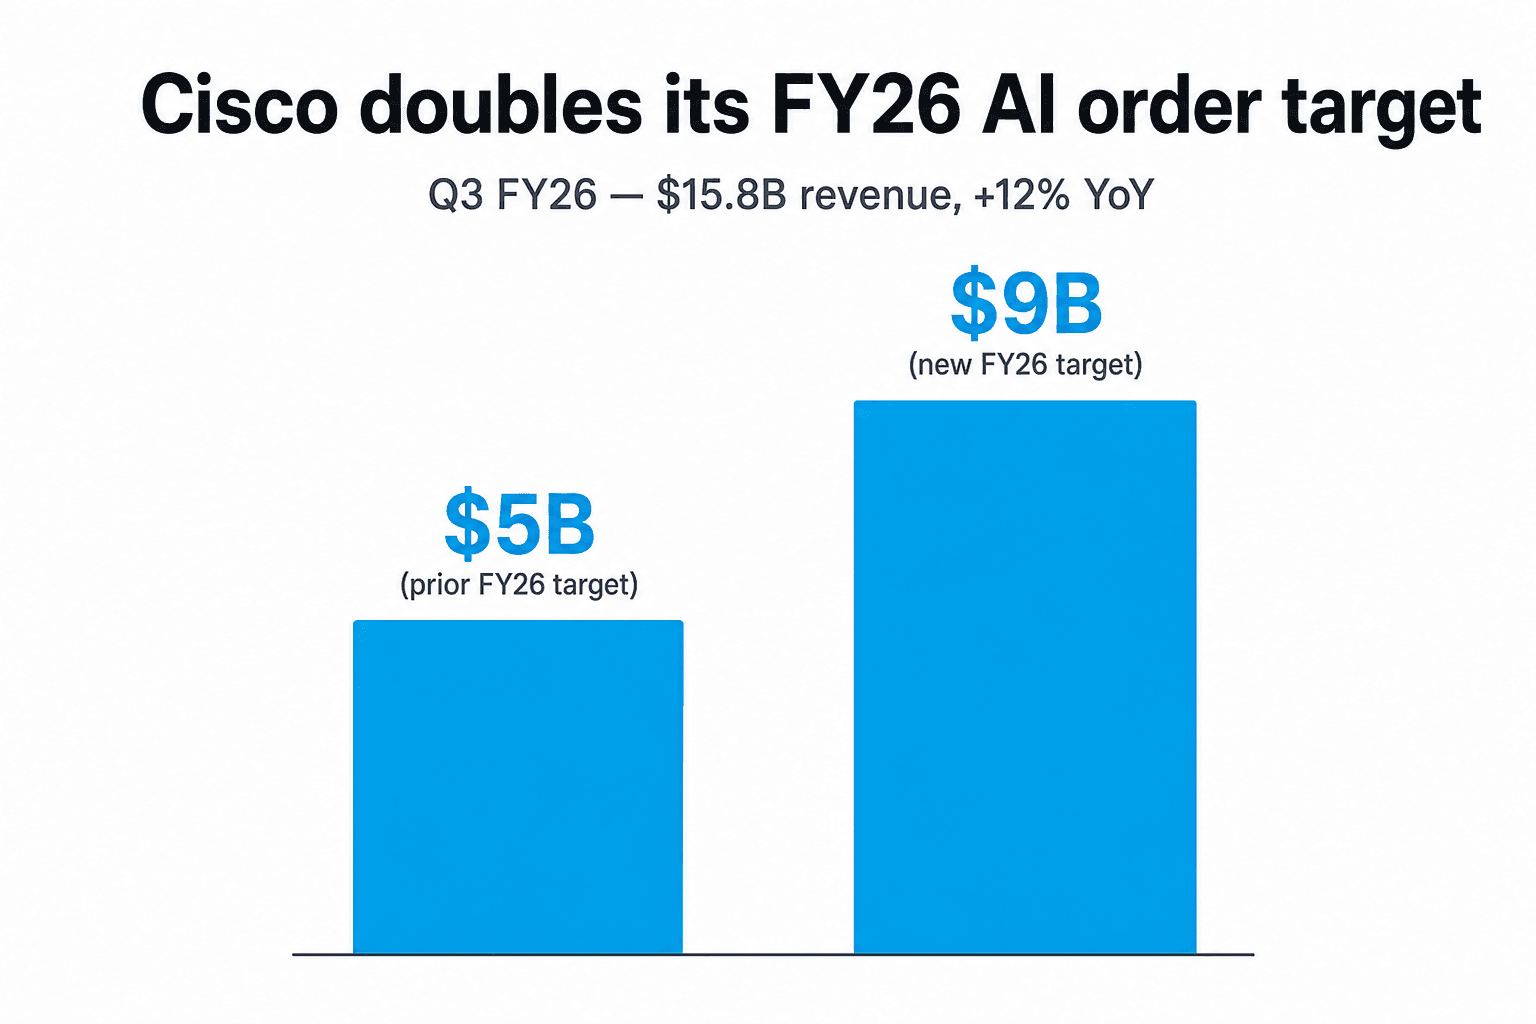
Cisco just doubled its FY26 AI order target — and the boring stuff is growing 19% too
Cisco printed record Q3 FY26 revenue of $15.8B (+12% YoY) and raised the FY26 hyperscaler AI order target from $5B to $9B. Even excluding hyperscalers, product orders grew +19% YoY — the strongest broad-based demand in a decade.
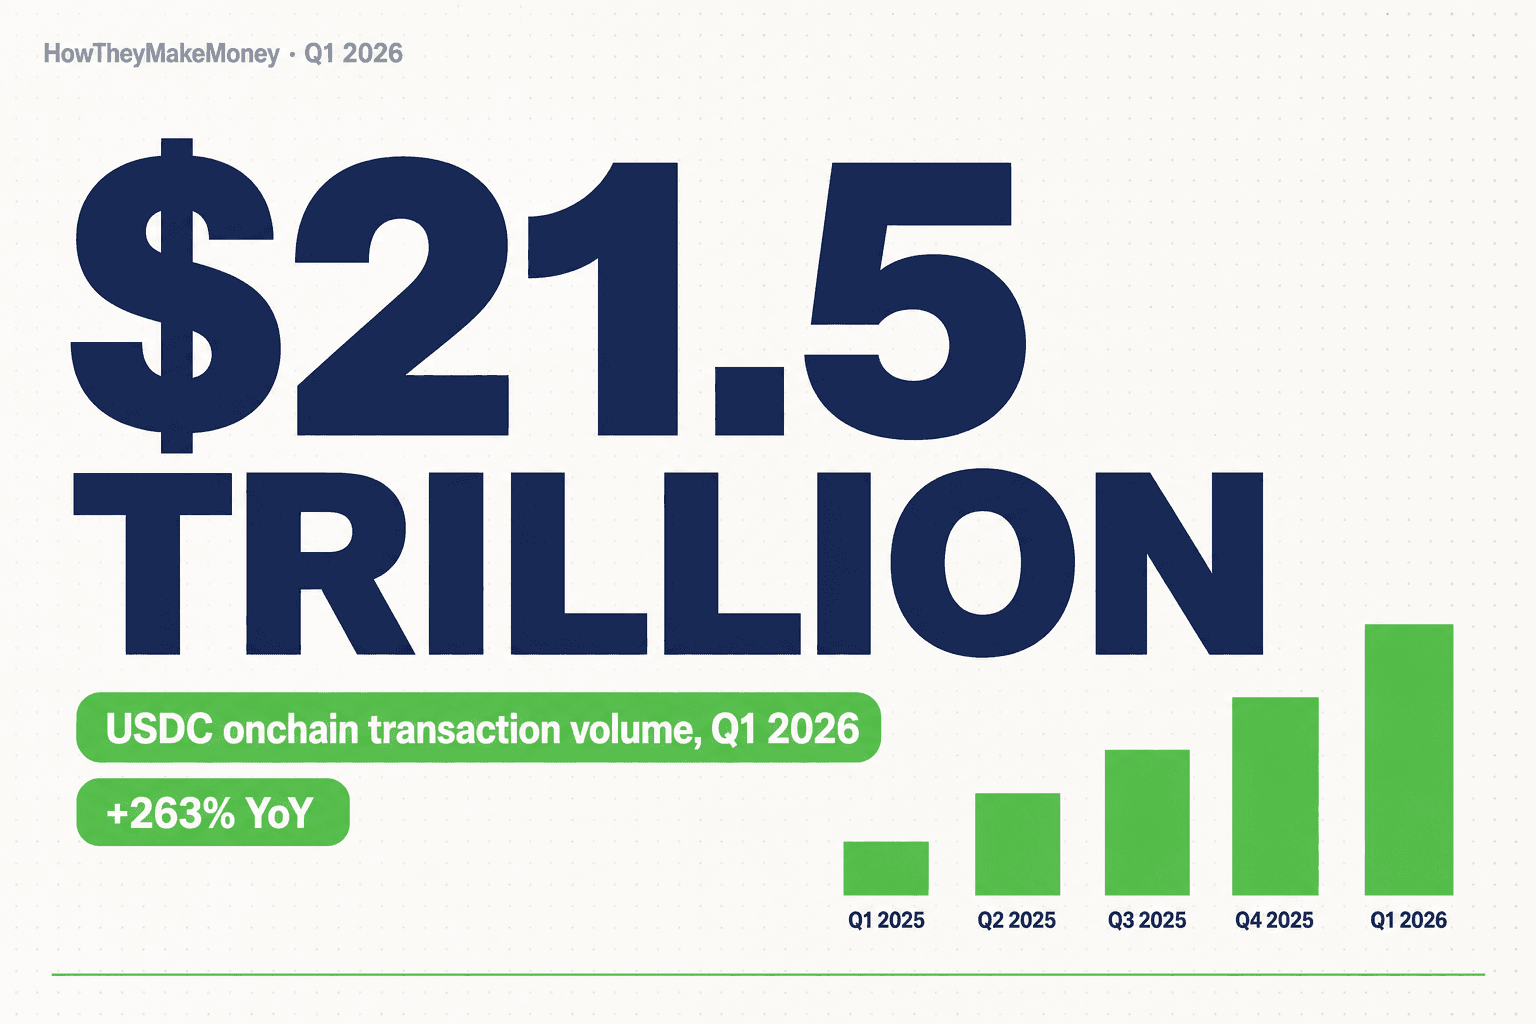
Circle Q1 2026: USDC Just Quietly Took Majority Utility Share
Circle's Q1 2026 print delivered $694M revenue (+20% YoY) and a +17% stock-day. The real story is structural: USDC is now ~80% of onchain dollar transactions, the on-platform slice jumped from 5.7% to 17.2% of circulation, and RLDC margin expanded 130 bps QoQ despite a 47-bp Fed-cut drag.
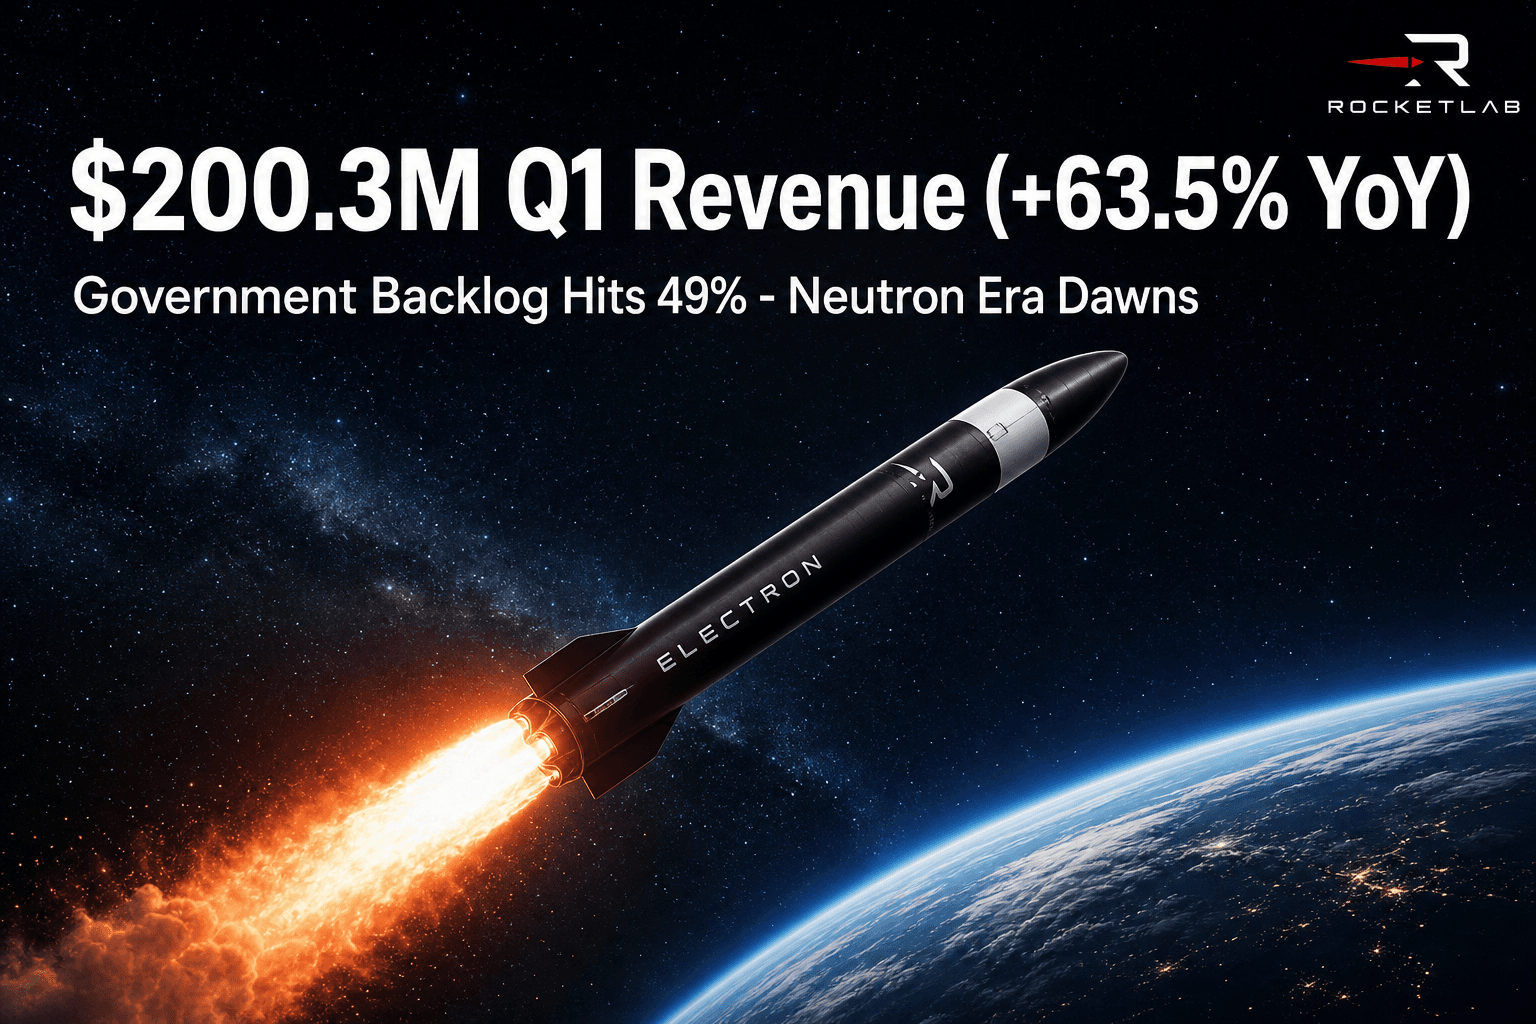
Rocket Lab's Government Inflection: When a Launch Services Company Becomes Defense Infrastructure
Rocket Lab reported Q1 2026 revenue of $200.3M (+63.5% YoY), shattering guidance. The real story: government backlog nearly doubled to $1.08B (49% of total), signaling a structural shift from commercial launch services to defense-critical infrastructure. Anduril partnership + Mynaric acquisition + $190M MACH-TB 2.0 contract reframe the entire bull thesis.
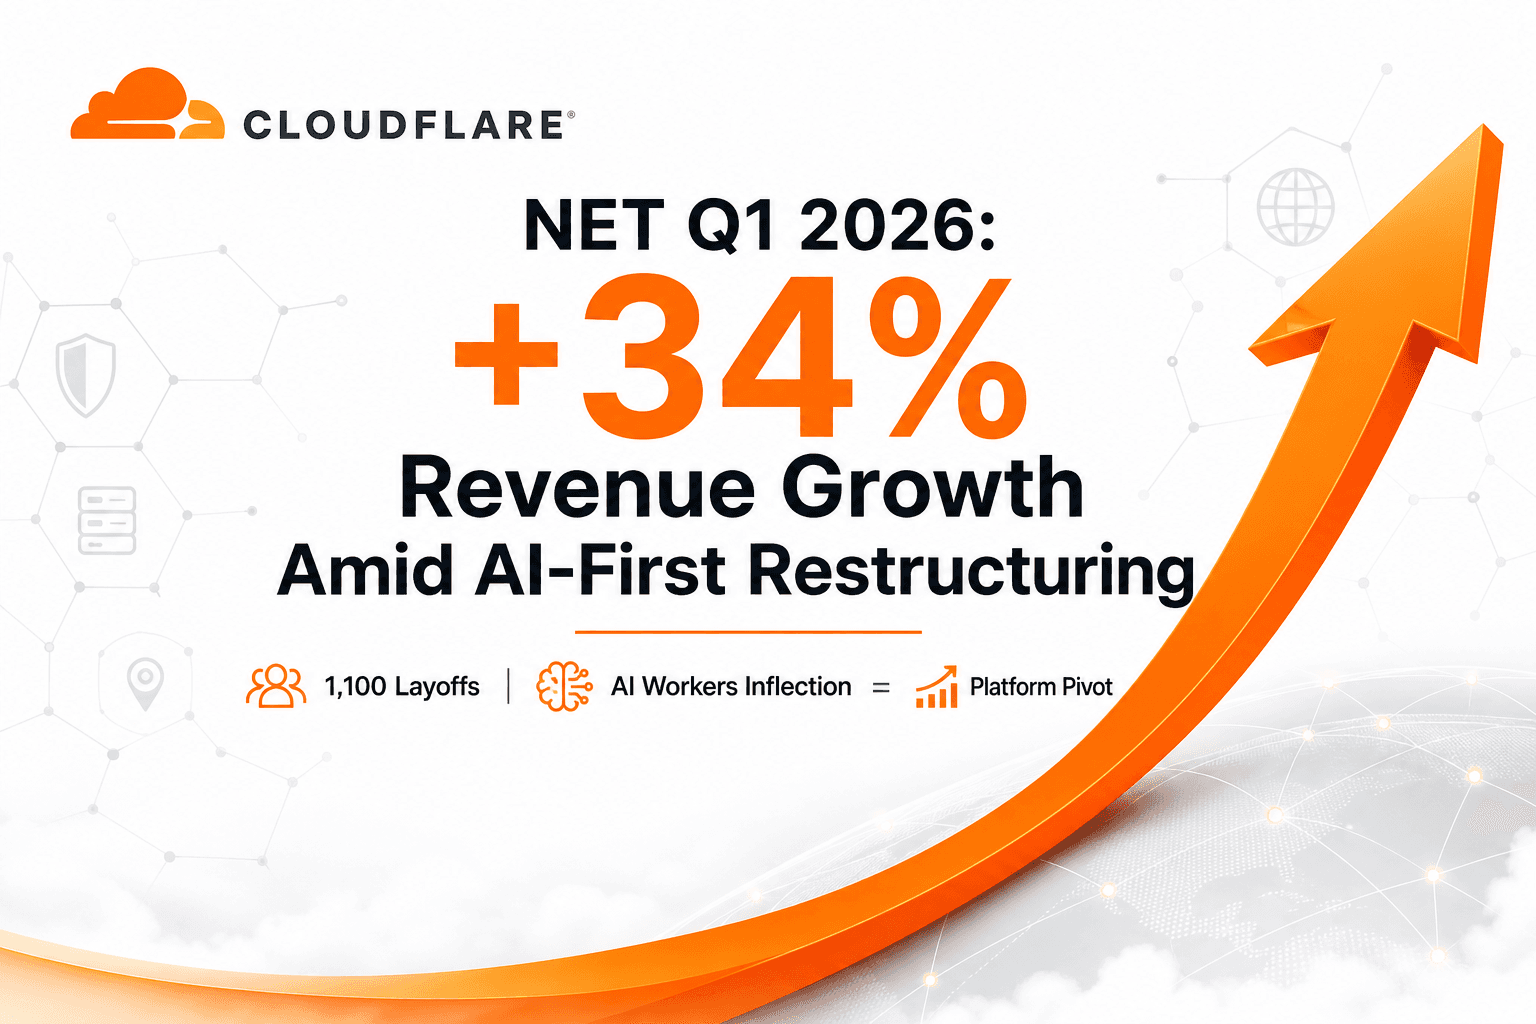
Cloudflare bets the company on AI while cutting 1,100 jobs—and Wall Street rewarded the gamble
NET Q1 2026 earnings: $640M revenue (+34% YoY), $0.53 EPS beat, 50% FCF growth, but gross margin compressed by AI infrastructure costs. The real story: CEO Matthew Prince's restructuring is positioning Cloudflare as an edge-AI platform, not a DDoS vendor.
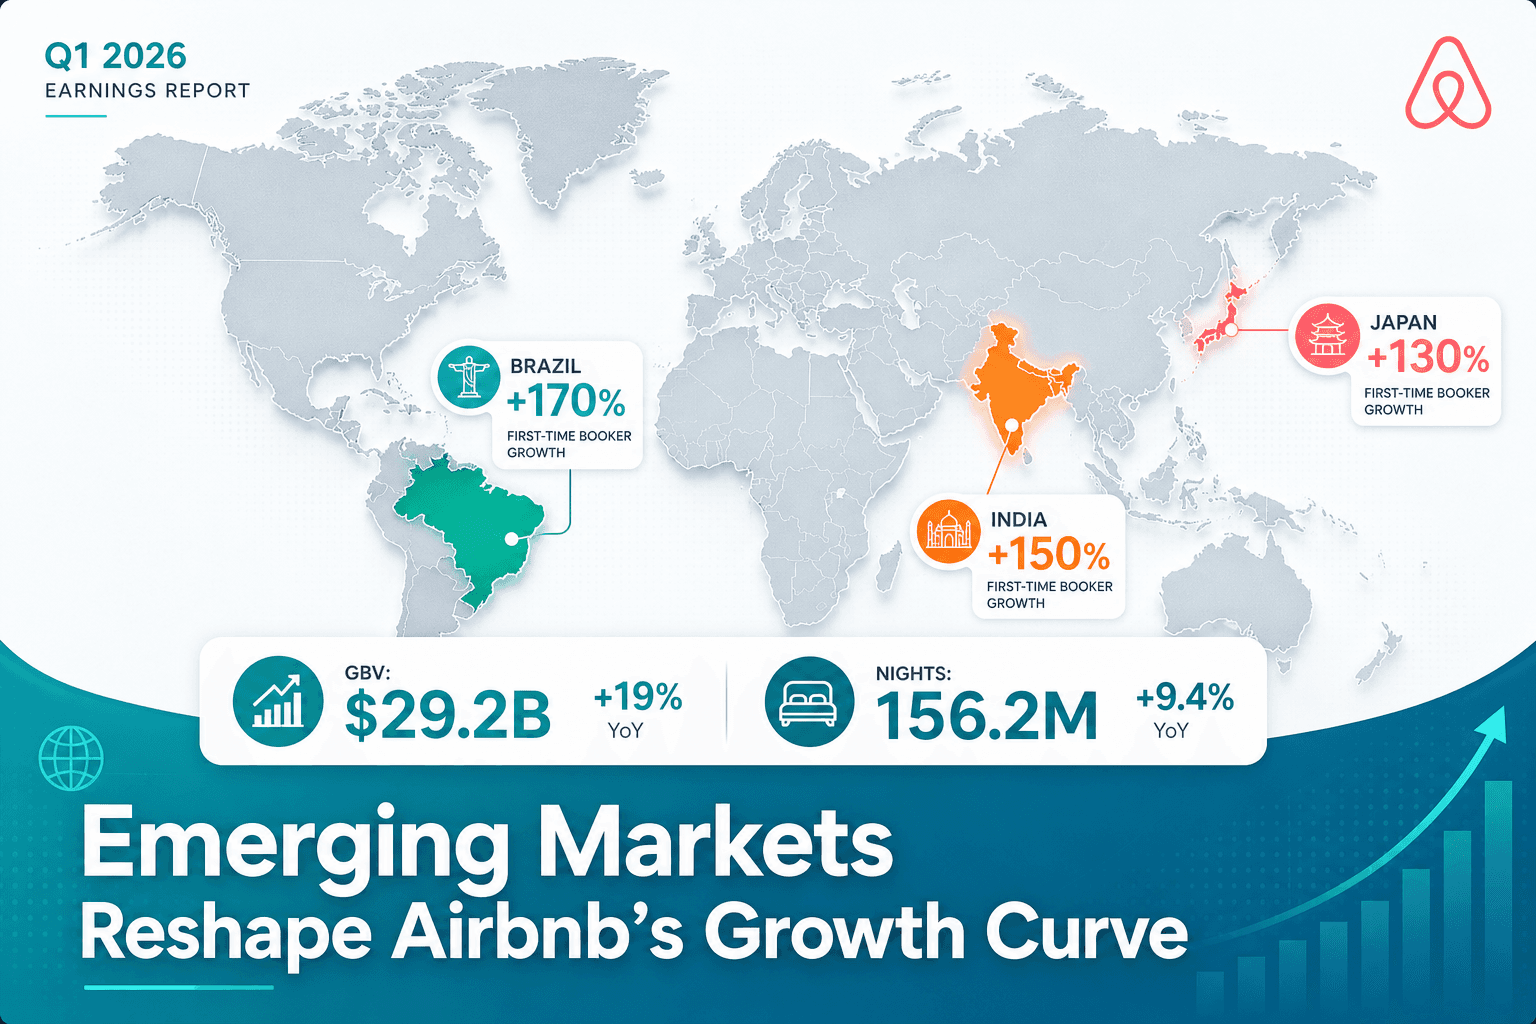
Airbnb's Q1 2026: Emerging Markets Become the Engine, But Don't Miss the Margin Story
Airbnb reported Q1 2026 revenue of $2.68B (+18% YoY), beating consensus while guiding higher. The real story: first-time booker growth in Brazil, India, and Japan is reshaping the entire platform, with gross margin expanding 340 bps YoY despite ADR compression.
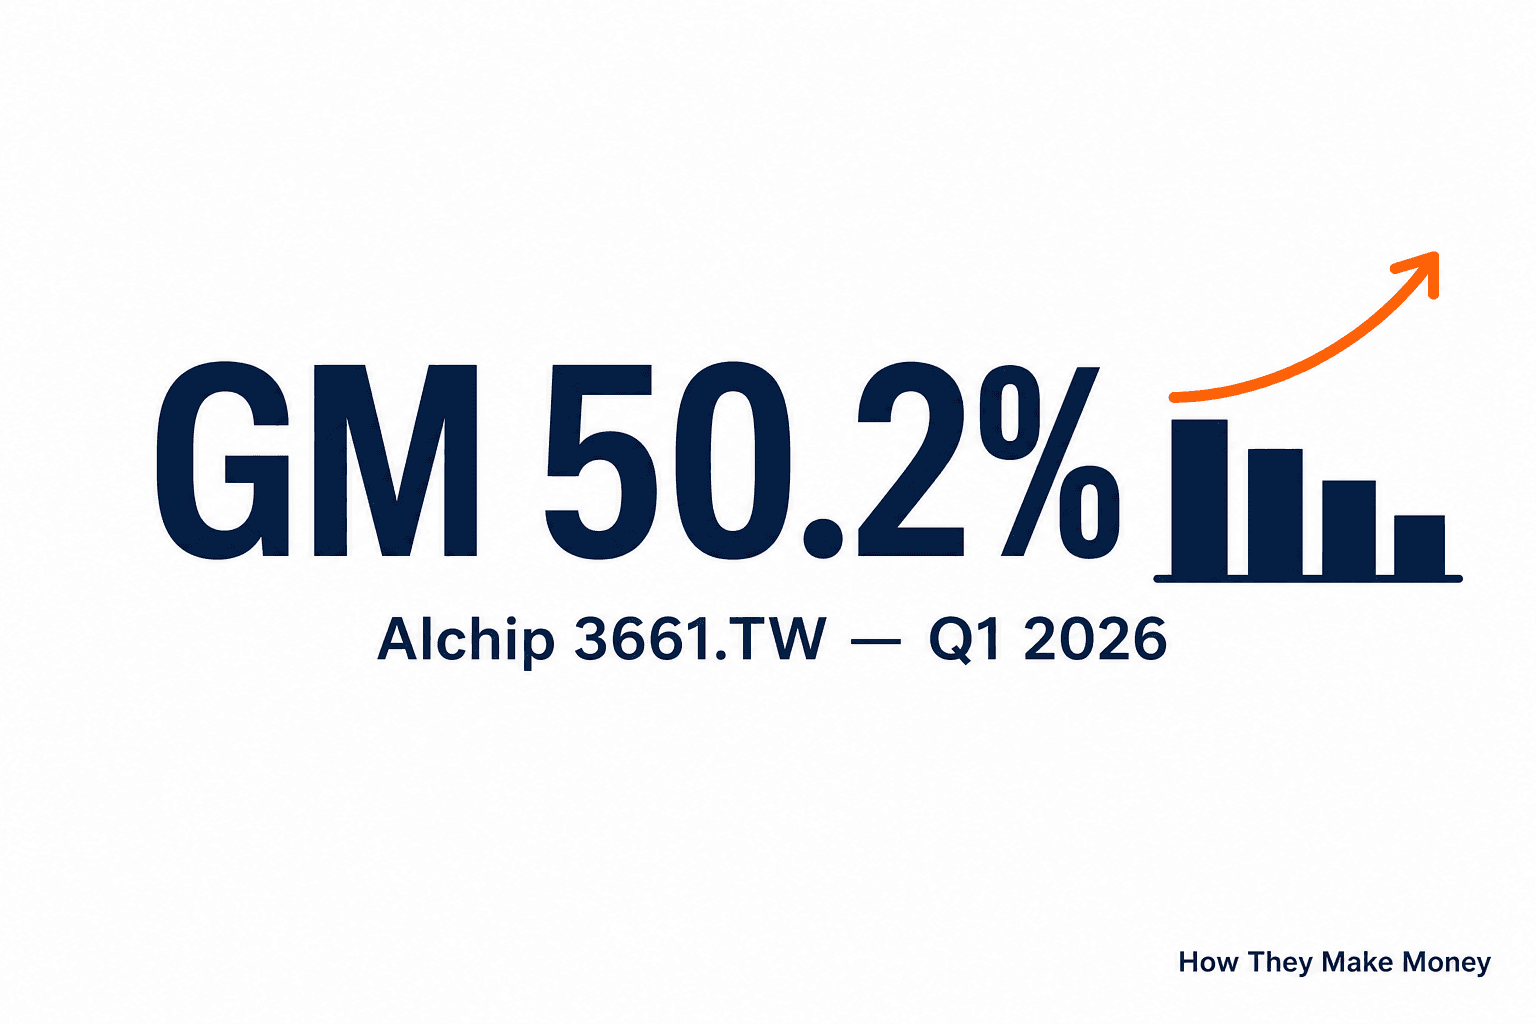
Alchip Q1 2026: Revenue Down 58% YoY, Gross Margin Breaks 50% for the First Time
Alchip (3661.TW) printed US$132.4M in Q1 2026 revenue (-13% QoQ, -58.5% YoY), but gross margin hit 50.2% (+806 bps QoQ, +2,610 bps YoY). Net income of US$45.1M was actually +1.6% YoY. This is what an NRE-led quarter looks like in the gap between two production cycles.
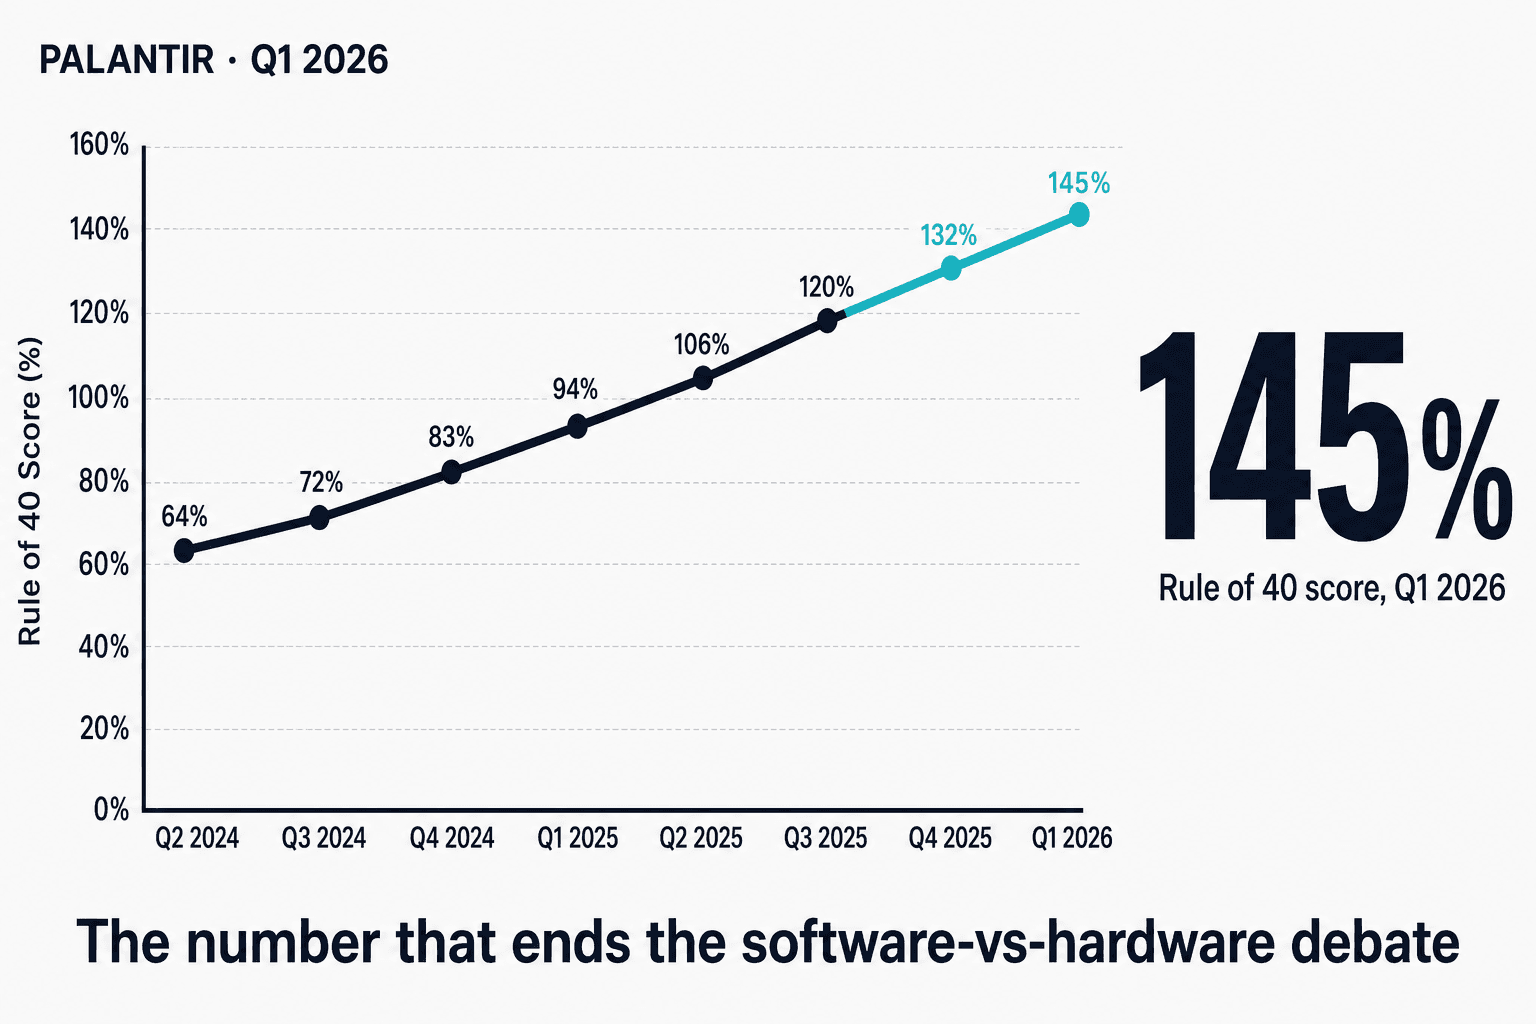
Palantir's Q1 2026: A Rule of 40 Score of 145% Is Not a Software Number Anymore
Palantir grew revenue 85% YoY, ran a 60% adjusted operating margin, and printed a Rule of 40 score of 145% — the kind of number companies like NVIDIA and Micron put up. Here's why that comparison is the whole story.
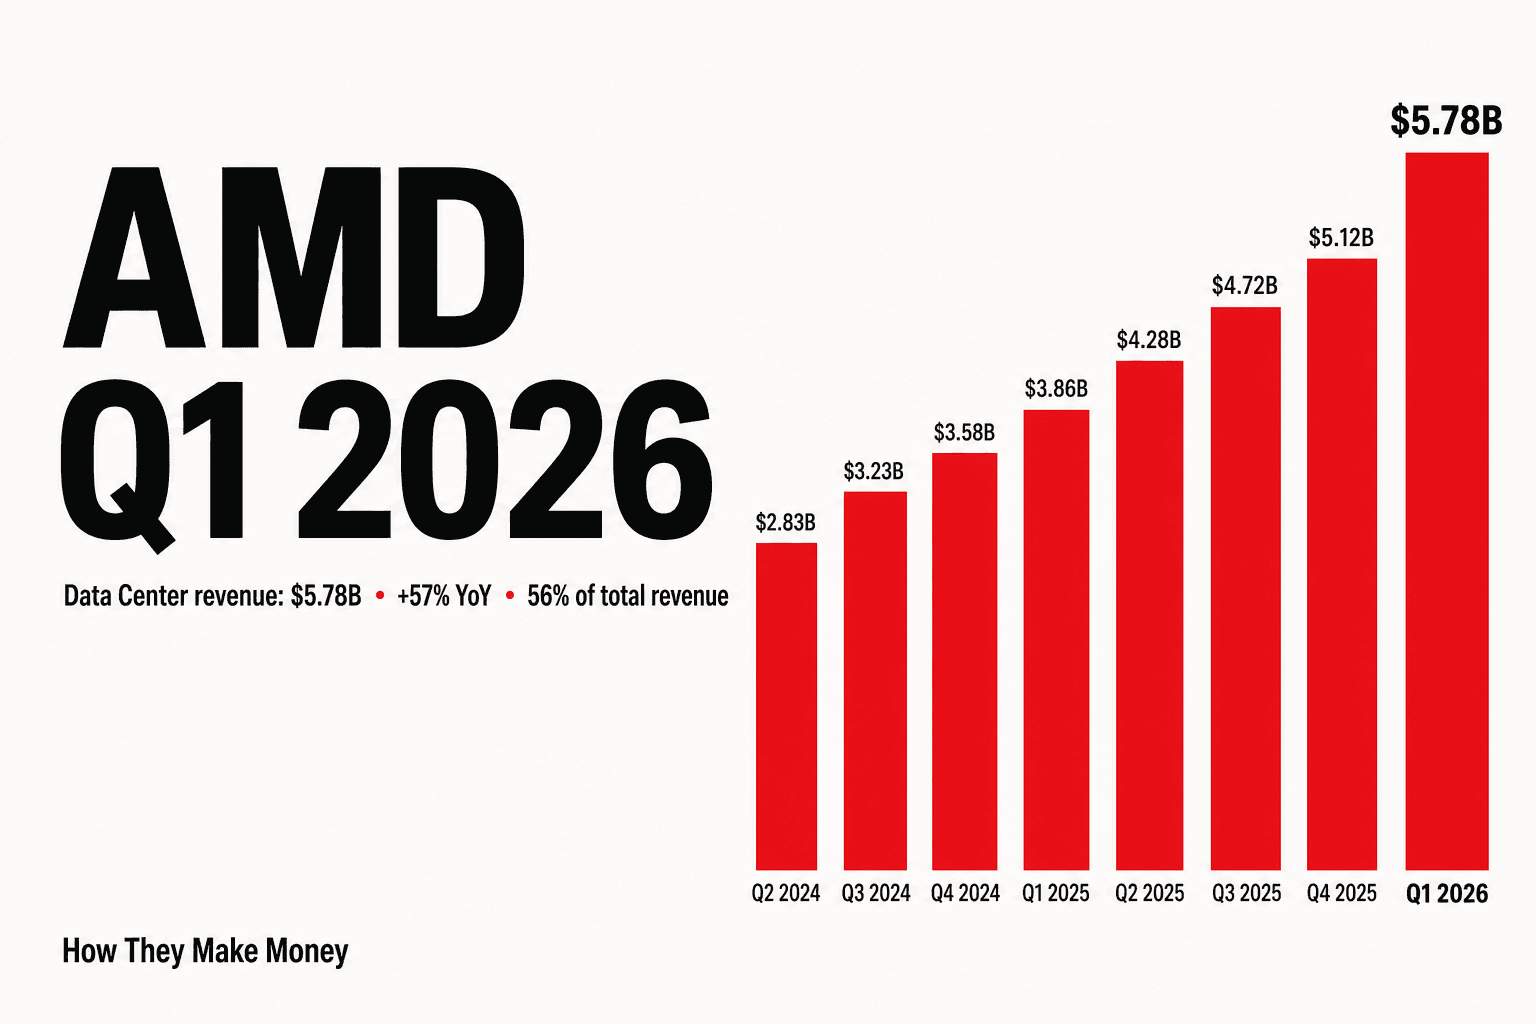
AMD Q1 2026: Data Center Becomes The Engine — 56% of Revenue, +57% YoY, $11.2B Q2 Guide
AMD printed $10.25B in Q1 2026 revenue, +38% YoY, with Data Center now 56% of the mix. Server CPU growth, the Meta 6 GW custom-MI450 deal, and a record 25% free cash flow margin reframe the AI compute share-of-wallet debate from 'can AMD win?' to 'how big is AMD's slice in 2027?'.
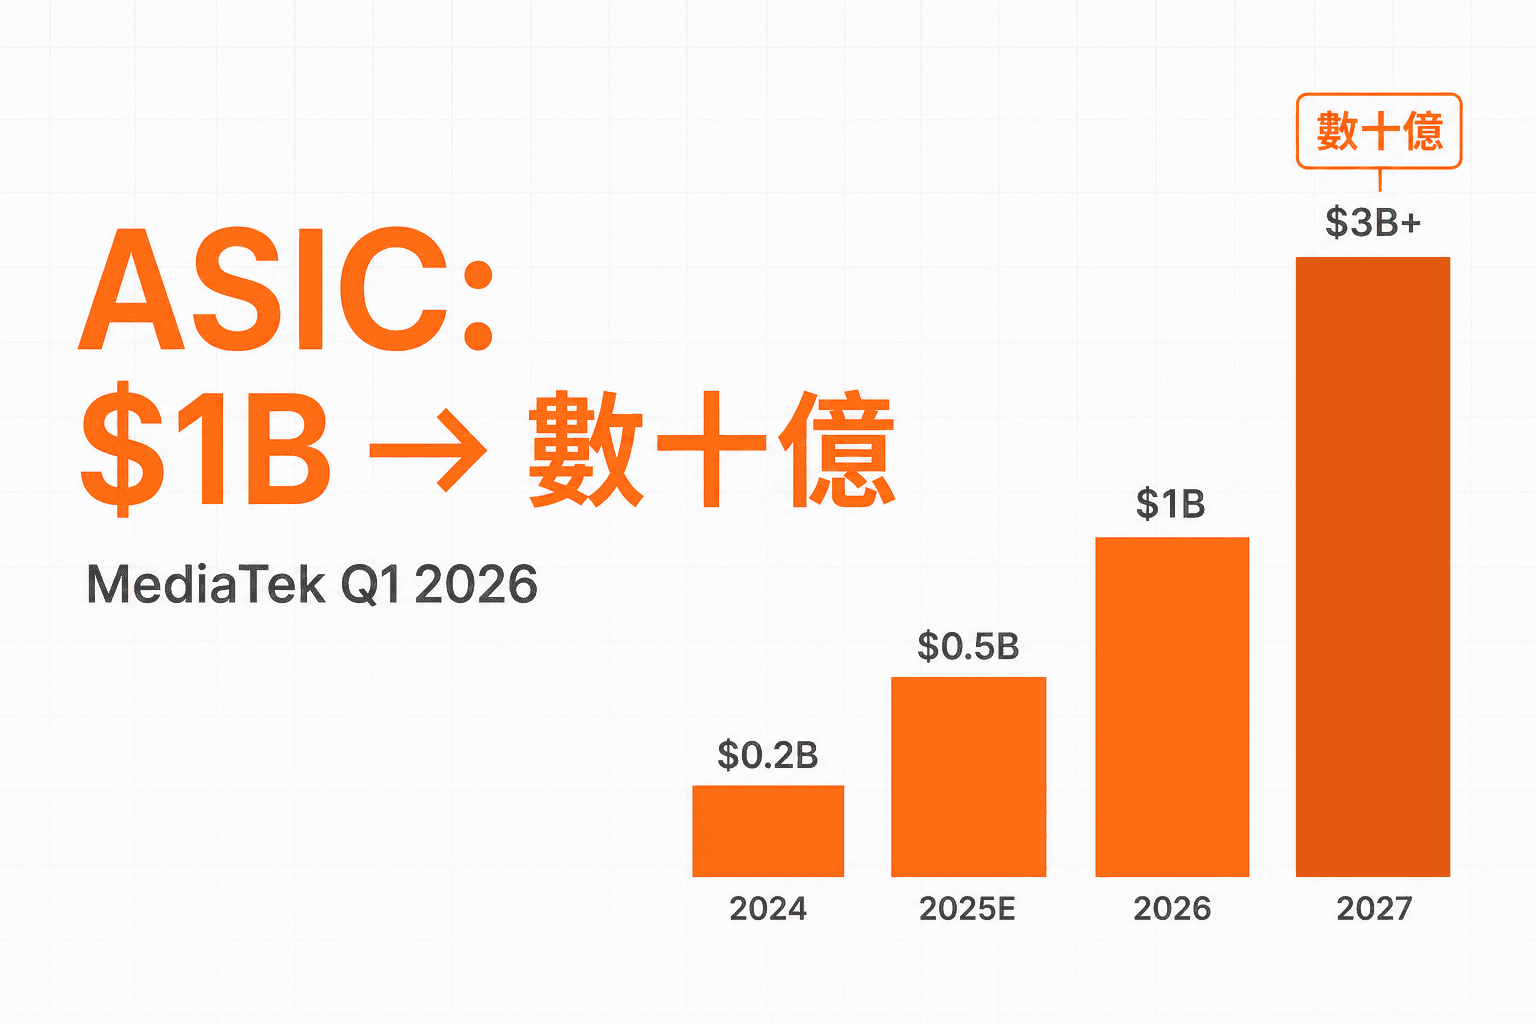
MediaTek Q1 2026: Data Center ASIC Finally Has a Number — $1B in 2026, 'Multi-Billion' in 2027
MediaTek printed a -17.7% YoY EPS decline and a -2.7% YoY revenue dip — the kind of quarter that gets sold. Instead the stock ripped +67% in 11 trading days, because Rick Tsai for the first time attached specific dollar figures to the data center ASIC business: above $1B in 2026, 'multi-billion' in 2027. The market didn't re-price Q1; it re-priced 2027 earnings power.
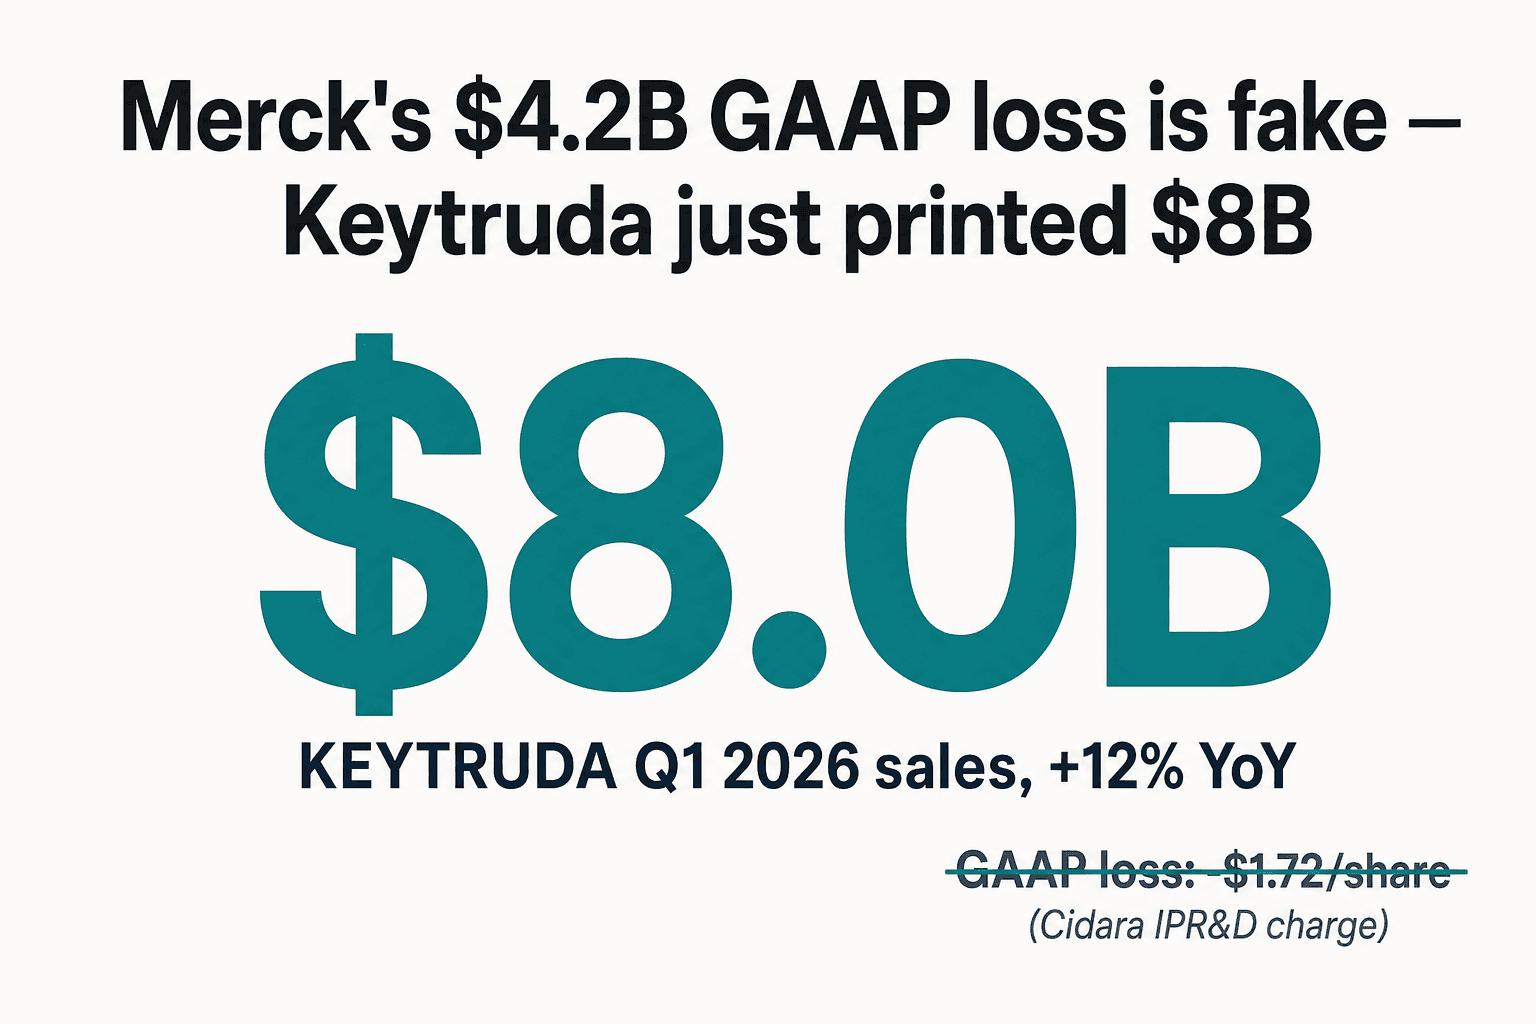
Merck just printed a $4.2B GAAP loss. The story is the $8B Keytruda line right above it.
Merck Q1 2026 sales of $16.3B (+5% YoY) beat estimates as Keytruda hit $8.0B (+12%) and Winrevair hit $525M (+88%). The $4.2B GAAP loss is entirely a Cidara acquisition IPR&D charge.
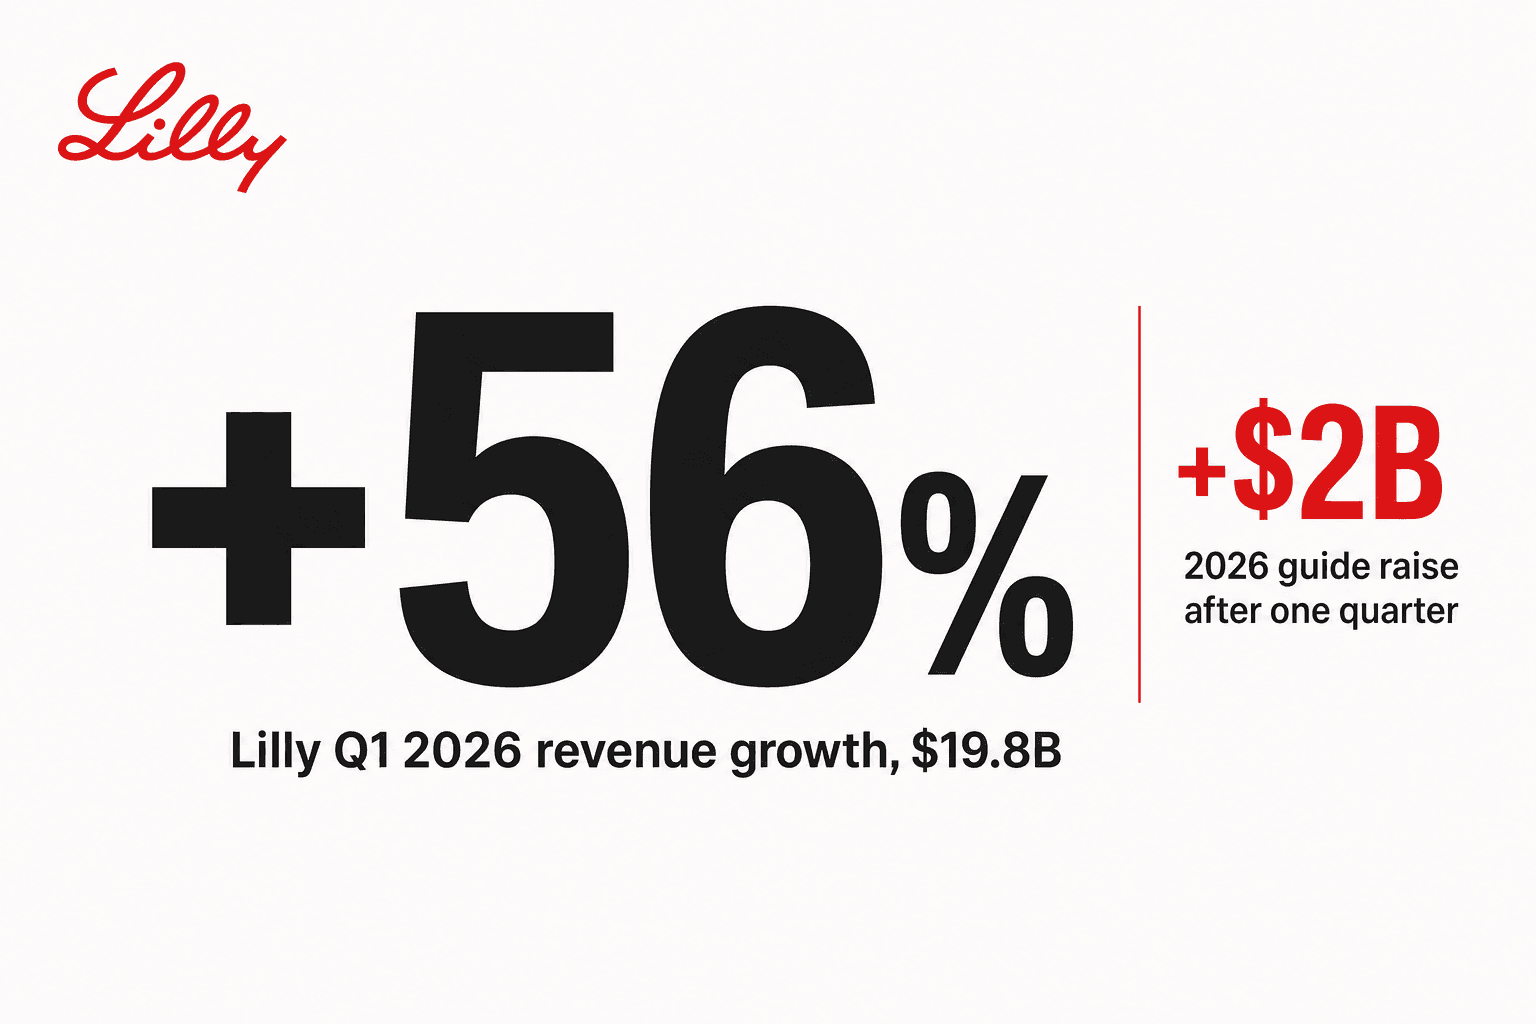
Eli Lilly grew 56% in a quarter. Then it raised its 2026 guide by another $2B.
Eli Lilly Q1 2026 revenue $19.8B (+56% YoY), Non-GAAP EPS $8.55 (+156%). Mounjaro hit $8.7B alone, beating Street by $1.4B. Foundayo (oral GLP-1) approved during the quarter. Full-year guide raised $2B at the midpoint.
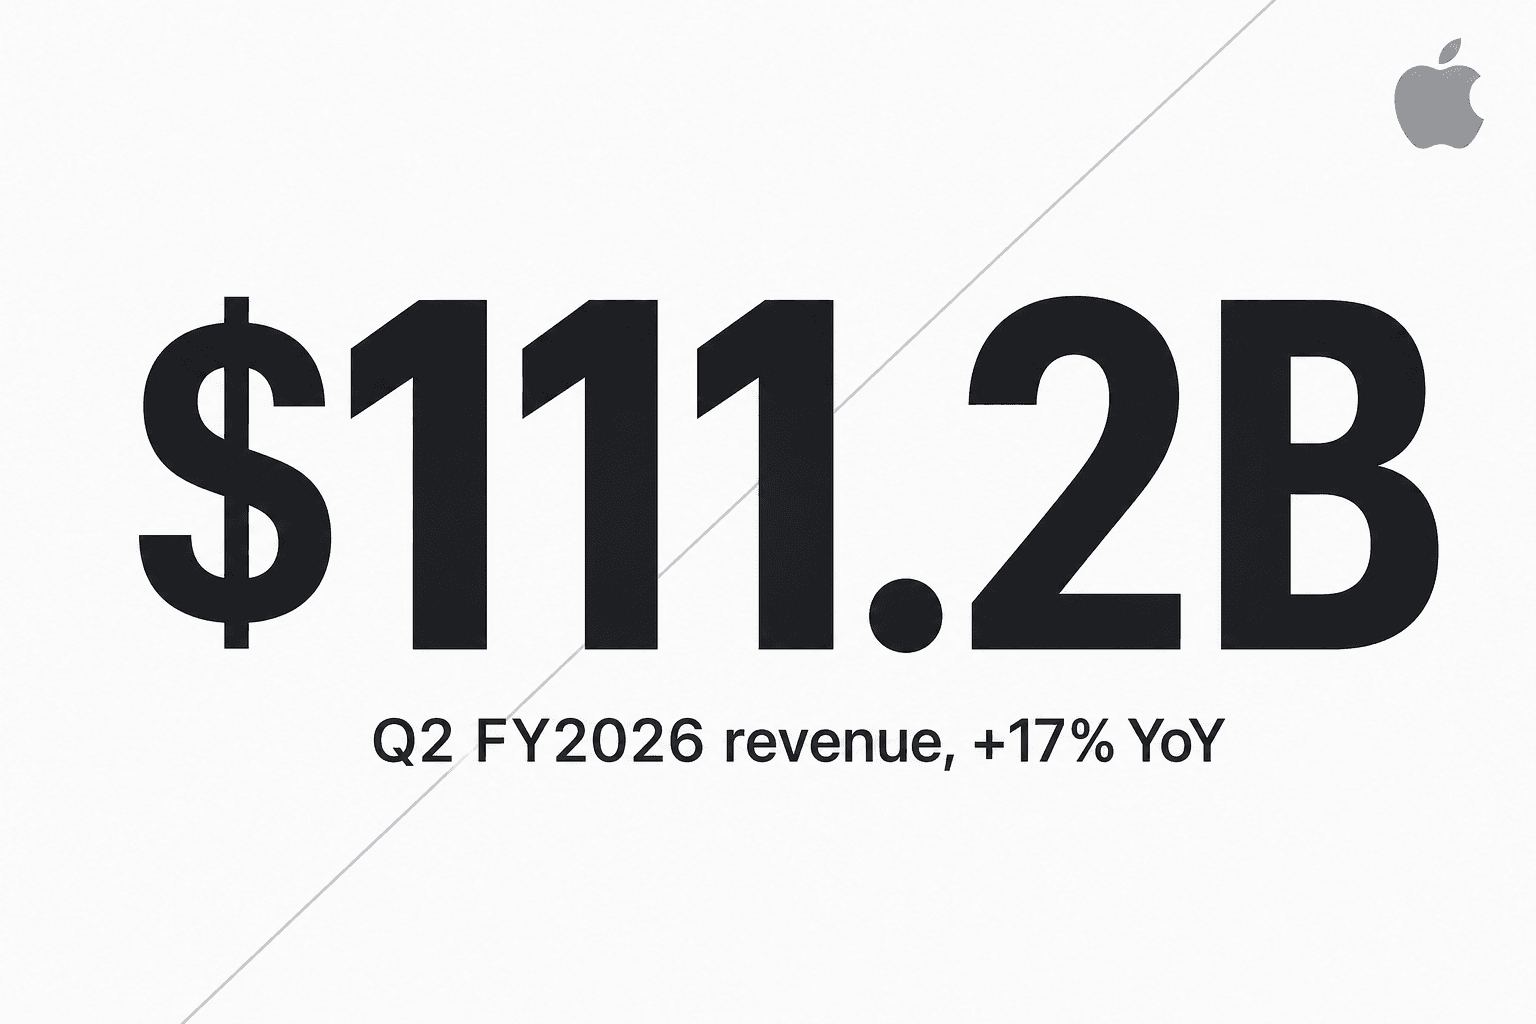
Apple just had its best March quarter ever — and Tim Cook's last as CEO
Apple posted $111.2B revenue (+17% YoY) and $2.01 diluted EPS in Q2 FY26 — March-quarter records on every line. The print landed 10 days after the company announced John Ternus would replace Tim Cook on Sept 1, 2026.
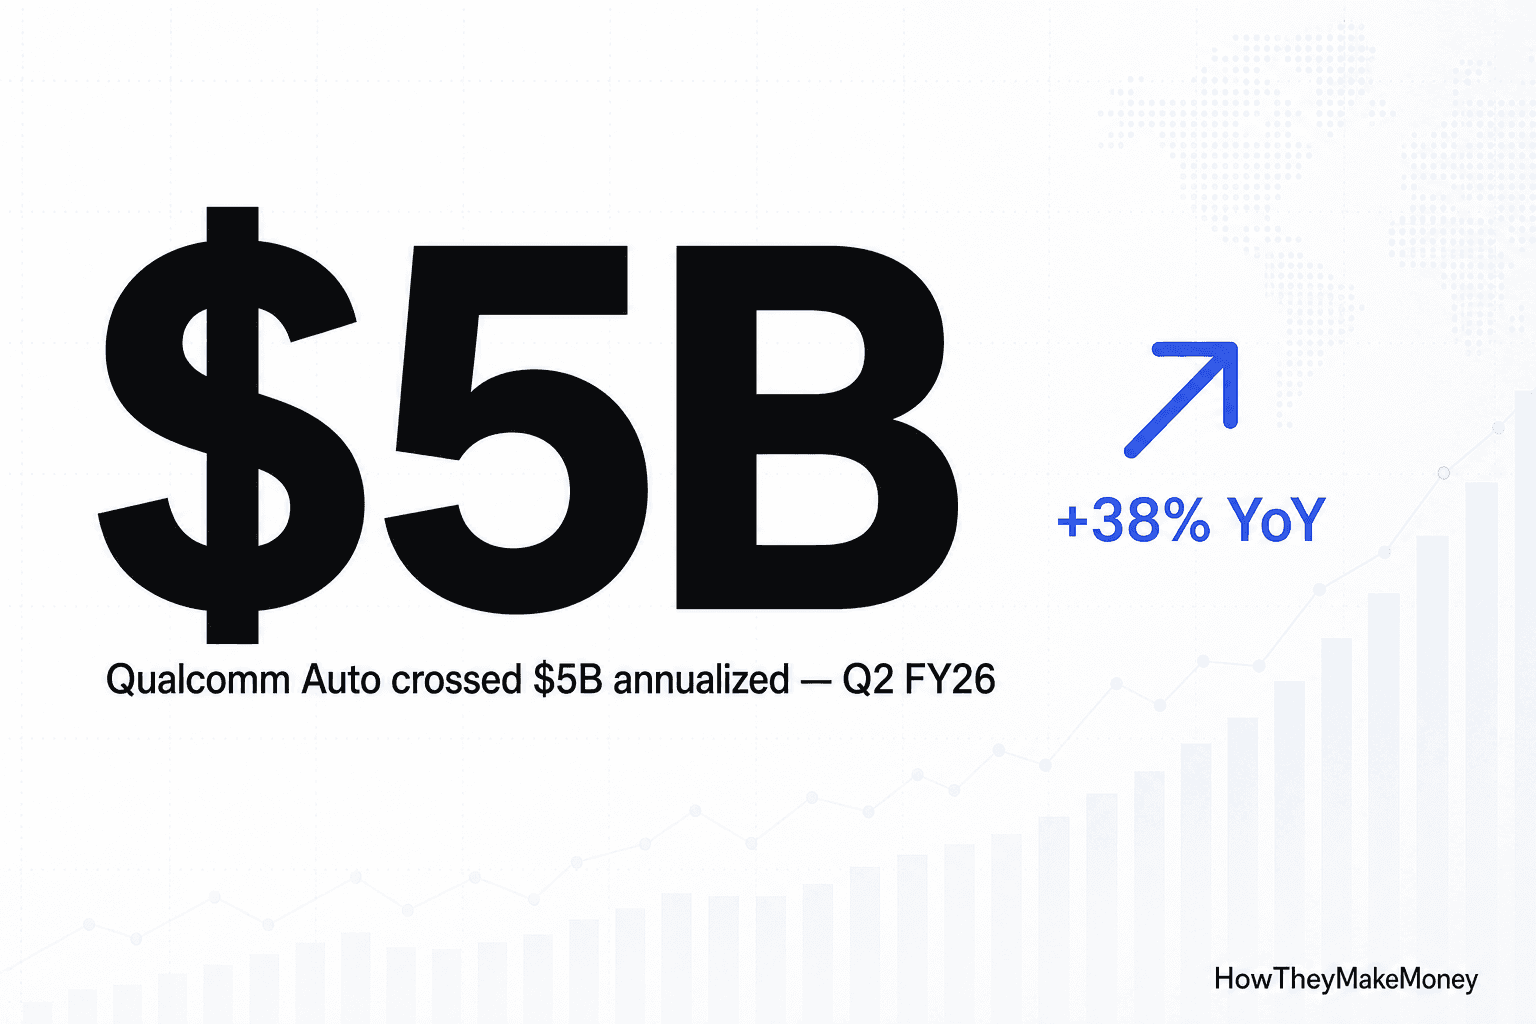
Qualcomm's Diversification Math Finally Showed Up — Just as Memory Pricing Broke Handsets
QCOM Q2 FY26 prints the first ever quarter of Auto >$5B annualized, +38% YoY — same quarter handset revenue dropped 13% YoY on China memory squeeze. The market chose the diversification story and gave the stock +2.7%.
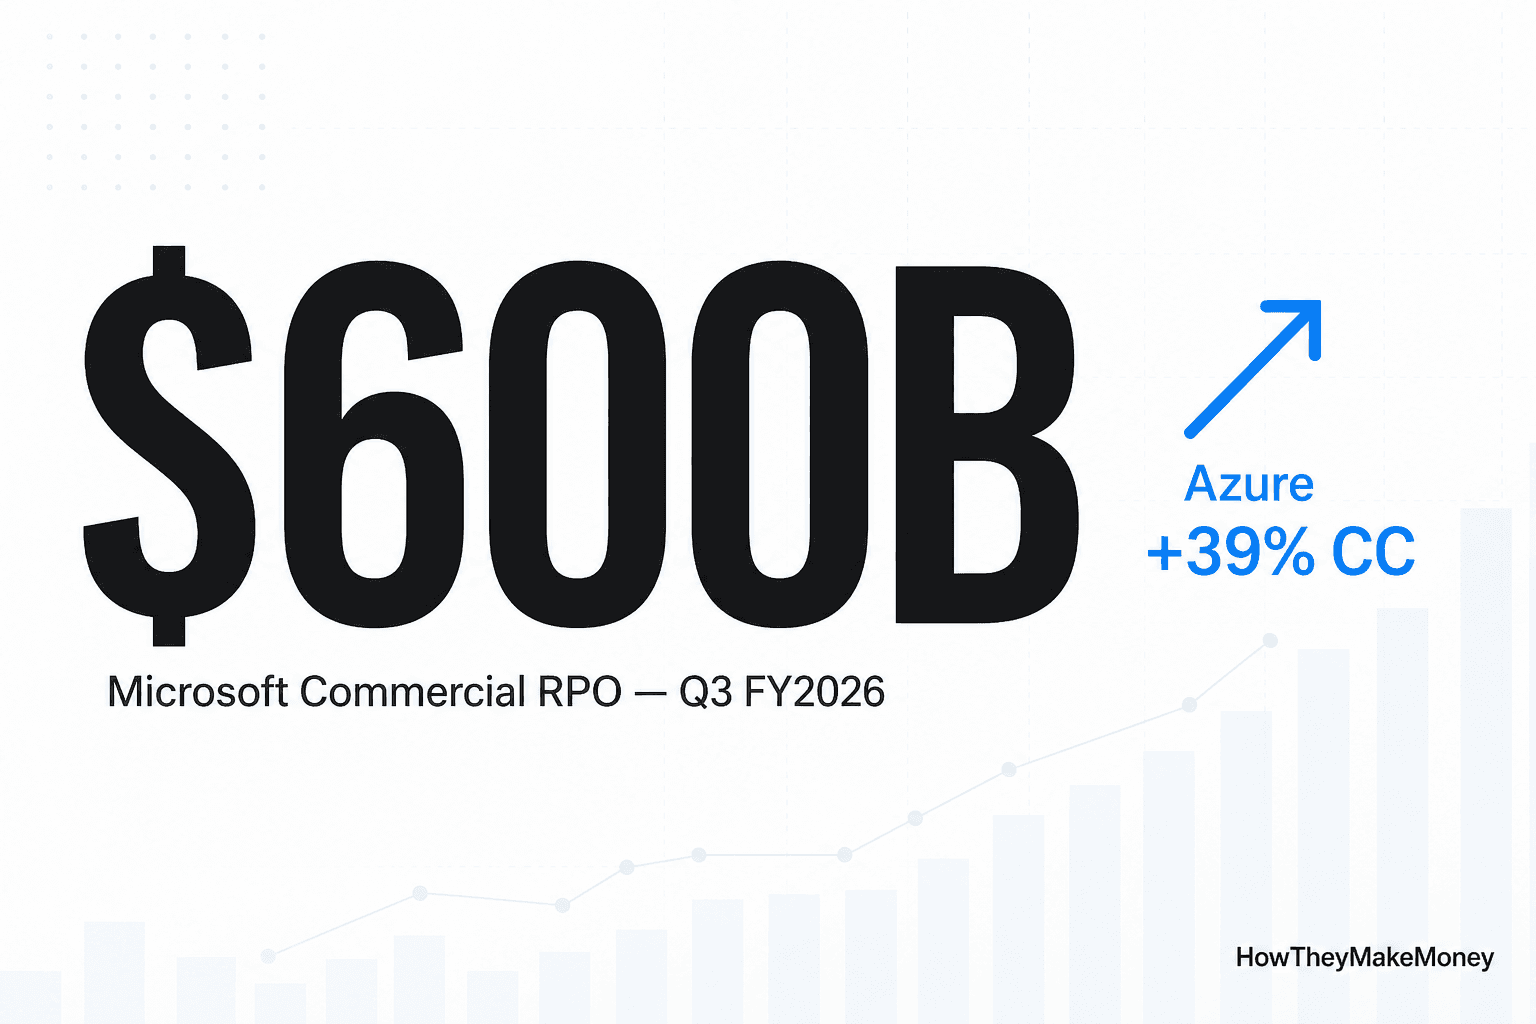
Microsoft Just Disclosed the Largest Software Backlog Ever — and the Stock Closed Down
Azure +39% constant-currency, Copilot crosses 20M paid seats, AI ARR $37B, $600B+ commercial RPO. The print was the cleanest enterprise-AI quarter ever produced. The market still focused on the 64% Q4 Microsoft Cloud gross margin guide.
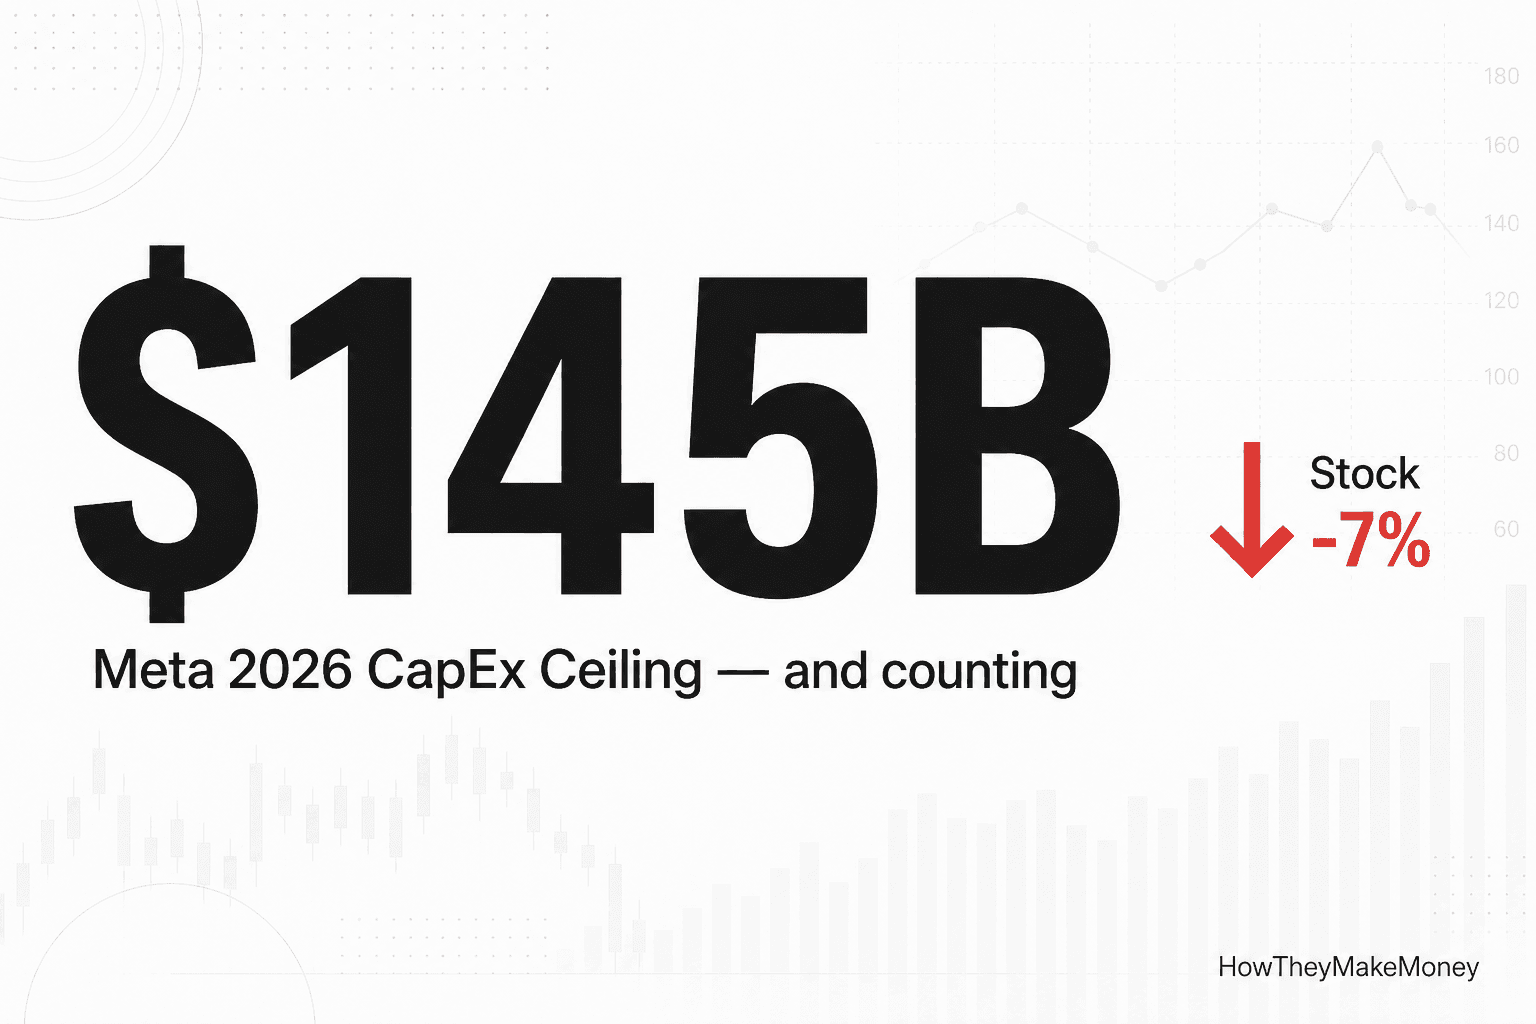
Meta Beat the Quarter and Lost the Story to a Single Sentence
Meta's Q1 2026 print beat revenue and EPS, but a 13-word answer from the CFO about 2027 capex sent the stock down 7% — its worst day since the 2022 Reality Labs shock.
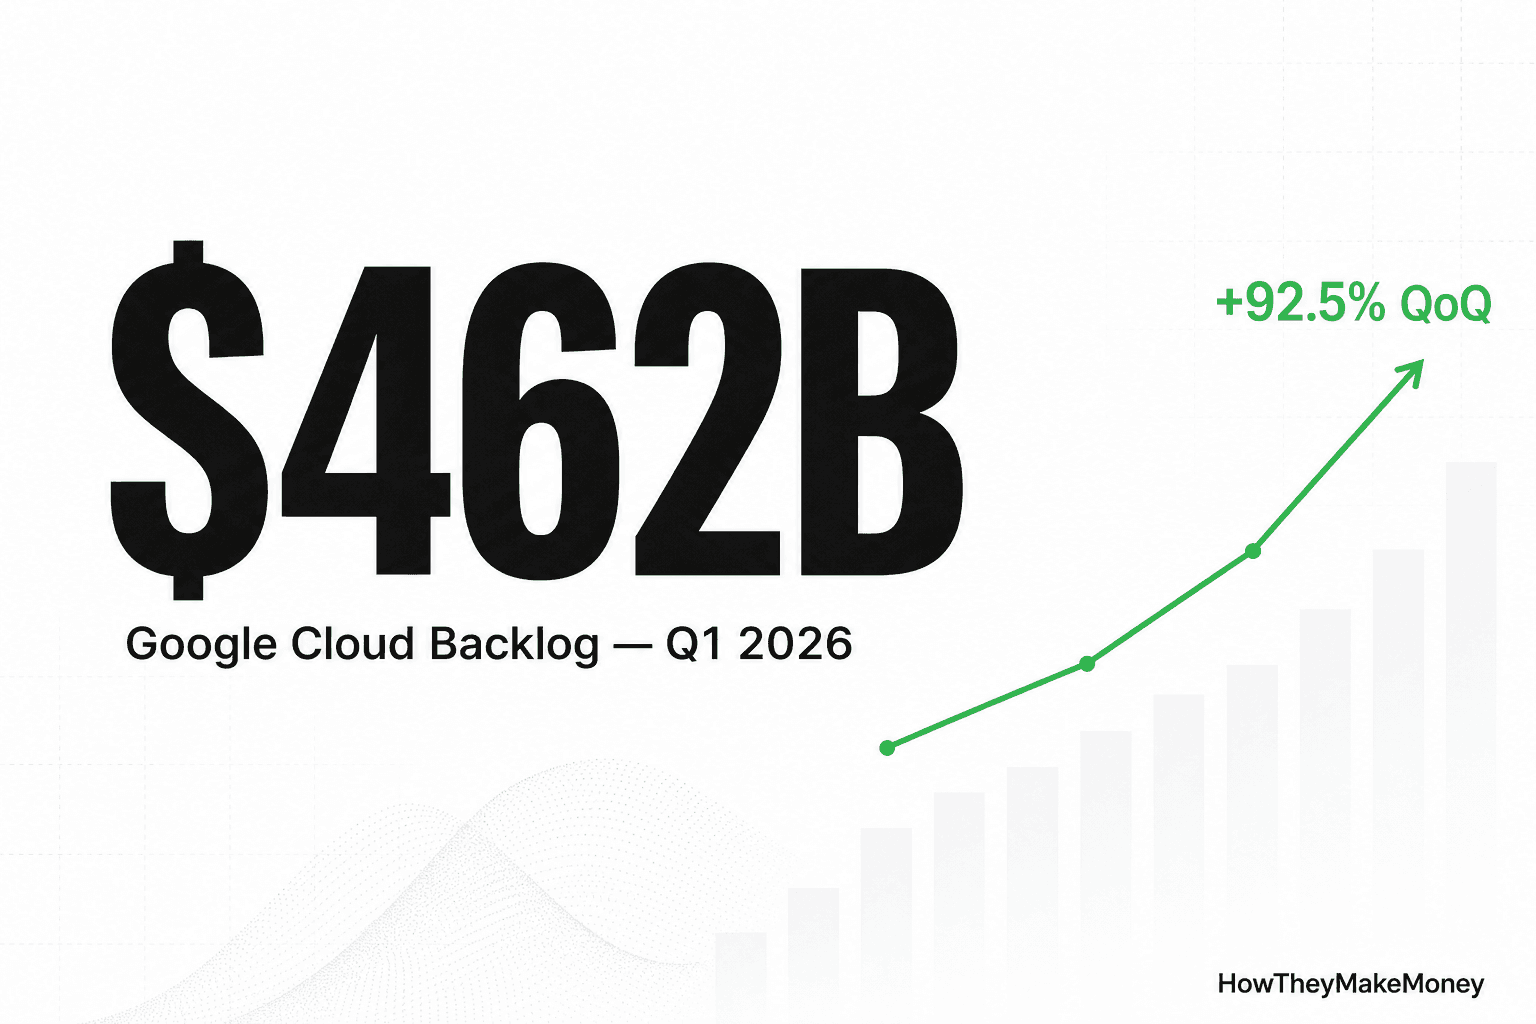
Alphabet's Q1 2026 Quietly Repriced the Cloud Wars
Google Cloud printed $20B in revenue, 32.9% operating margin, and a backlog that almost doubled in 90 days to $462B. The capex bill — $180-190B for 2026 — is the price of admission.
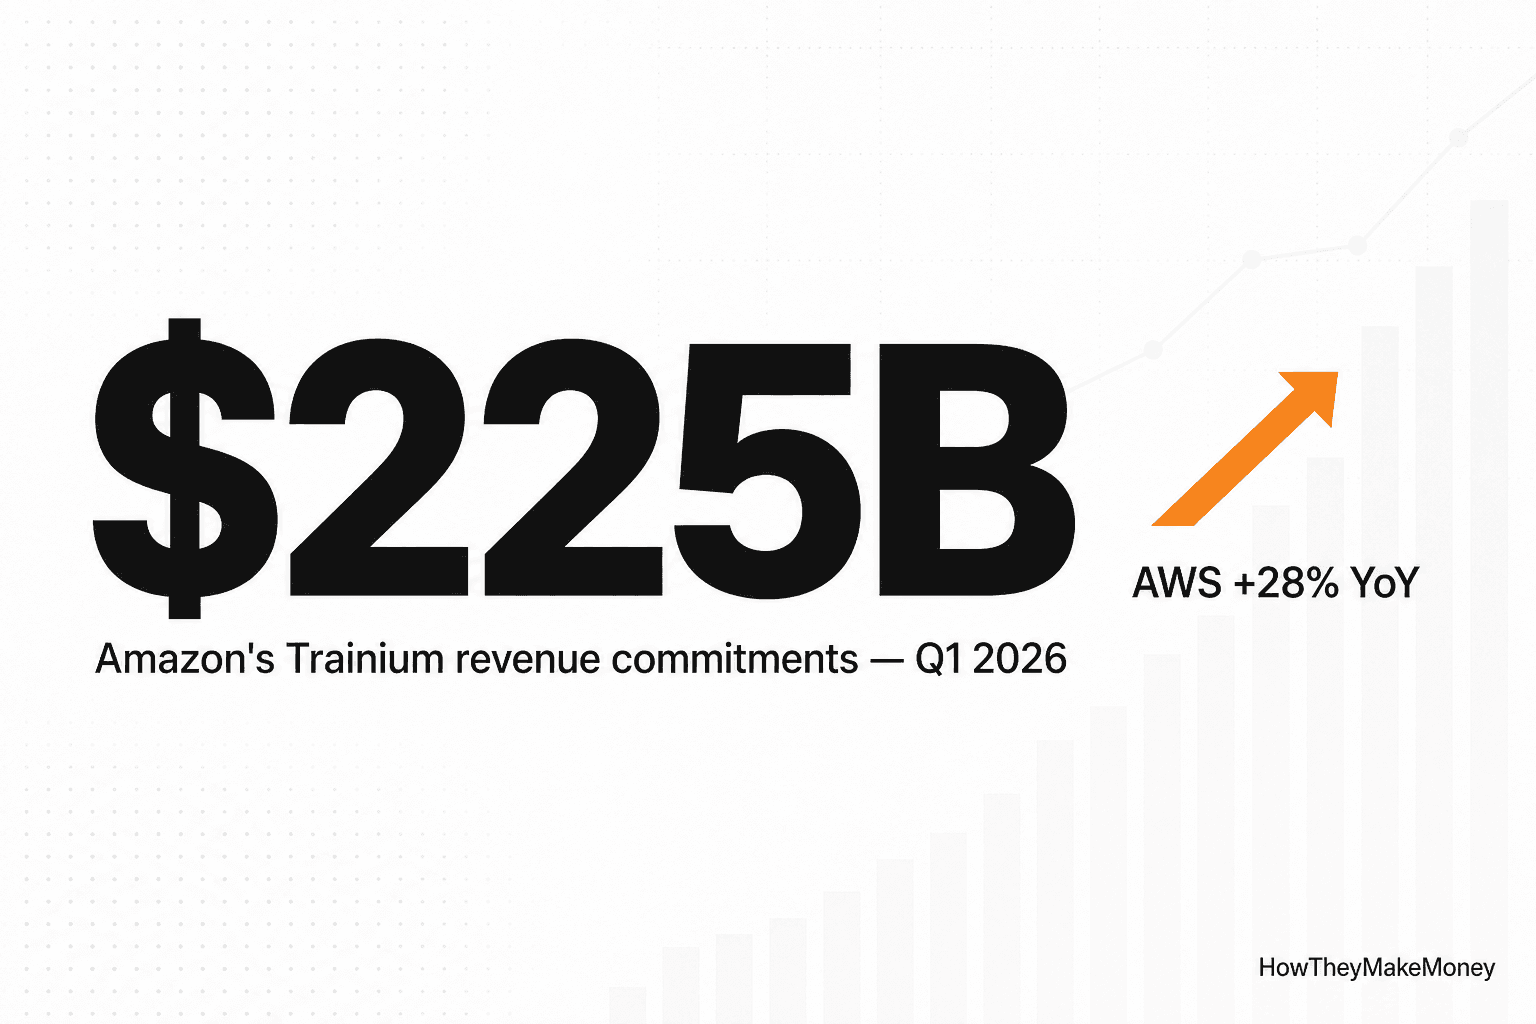
Amazon's Q1 2026 Was Three Records in One Print — and a $225B Backlog Nobody Saw Coming
AWS reaccelerated to +28% YoY (15-quarter high), North America retail margin hit a record 7.9%, and Andy Jassy disclosed $225B in signed Trainium commitments. The capex bill is $200B. The print is still a beat.
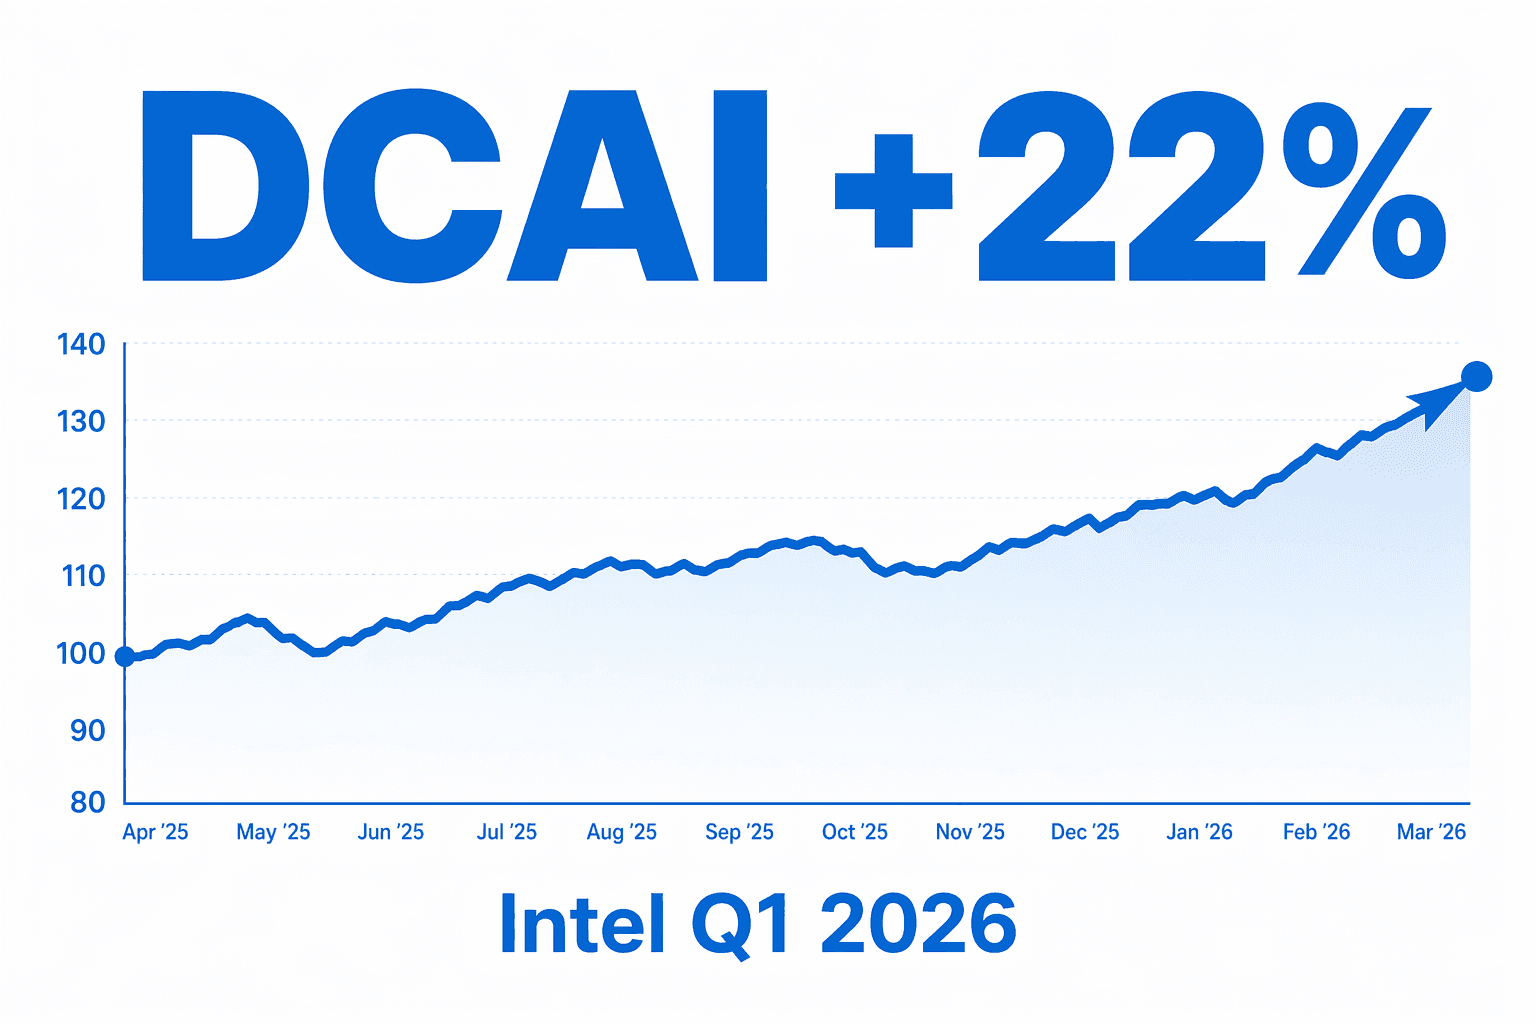
Intel's Q1 2026: DCAI +22%, Non-GAAP Margin at a 4-Year High, and Why the 'AI CPU' Narrative Finally Has a Number Behind It
Intel beat on revenue, margin and guidance in Q1 2026 — but the single datapoint that changed the narrative was a DCAI operating margin that more than doubled year-over-year, from 13.9% to 30.5%. This is what's different about this print.
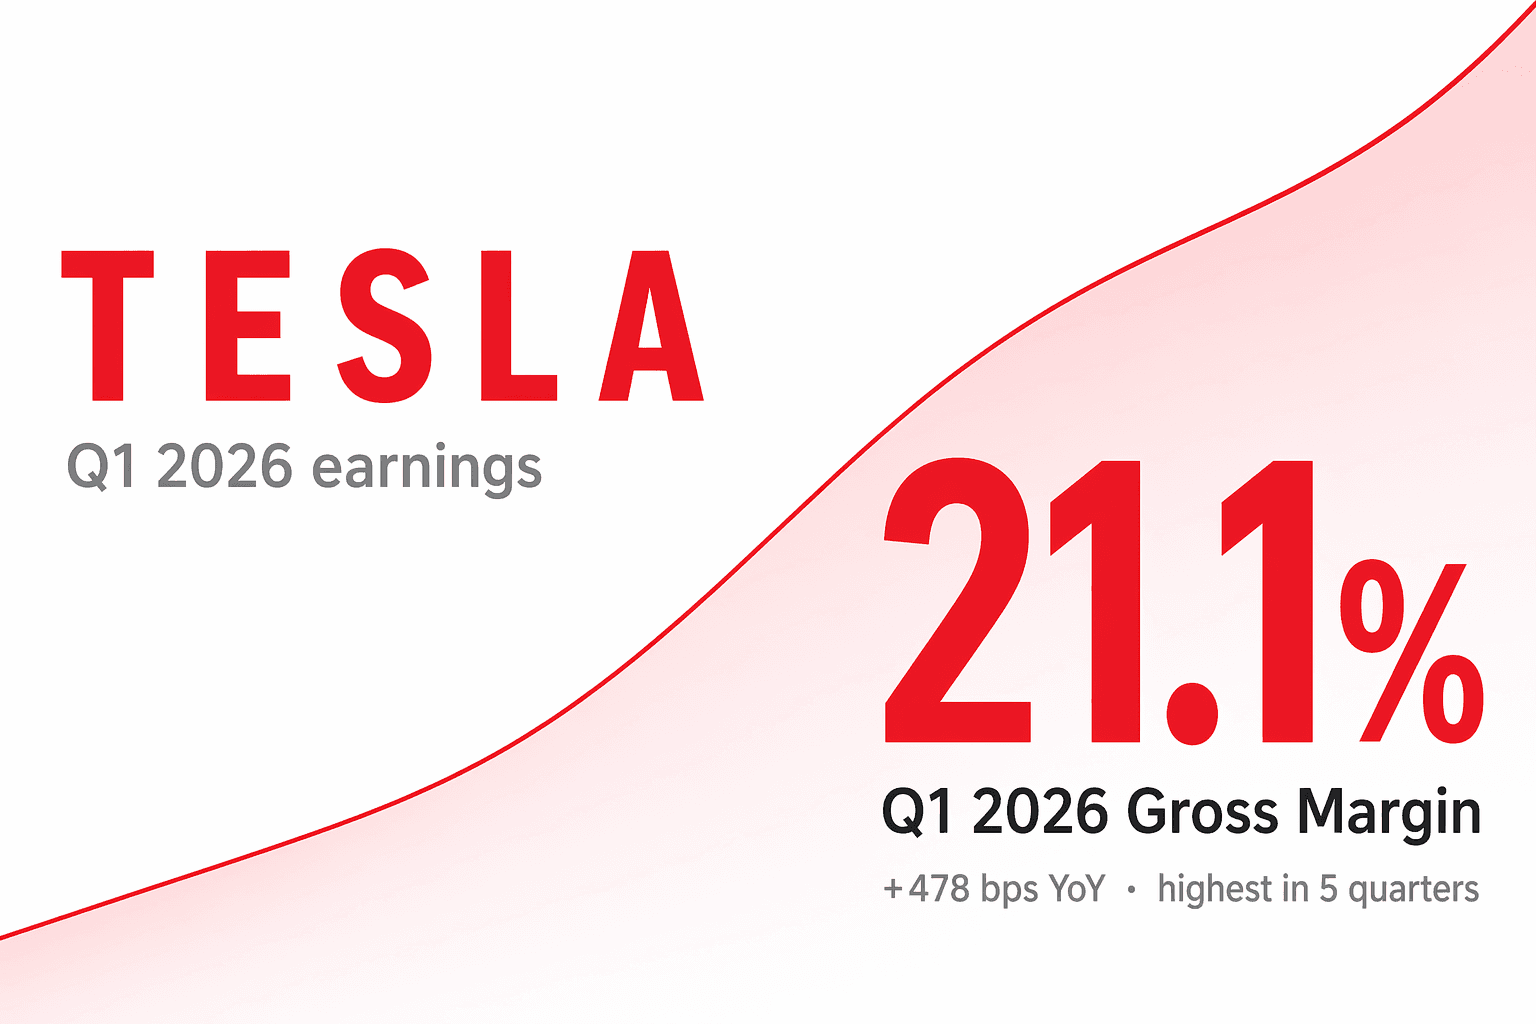
Tesla's Q1 2026 Margin Rebound Is Real — But the $25B CapEx Bill Is the Real Story
Tesla's Q1 2026 gross margin hit 21.1%, a 478 bps YoY jump and a five-quarter high. Yet the stock finished the day down 2%. Here is why the market looked past the beat.
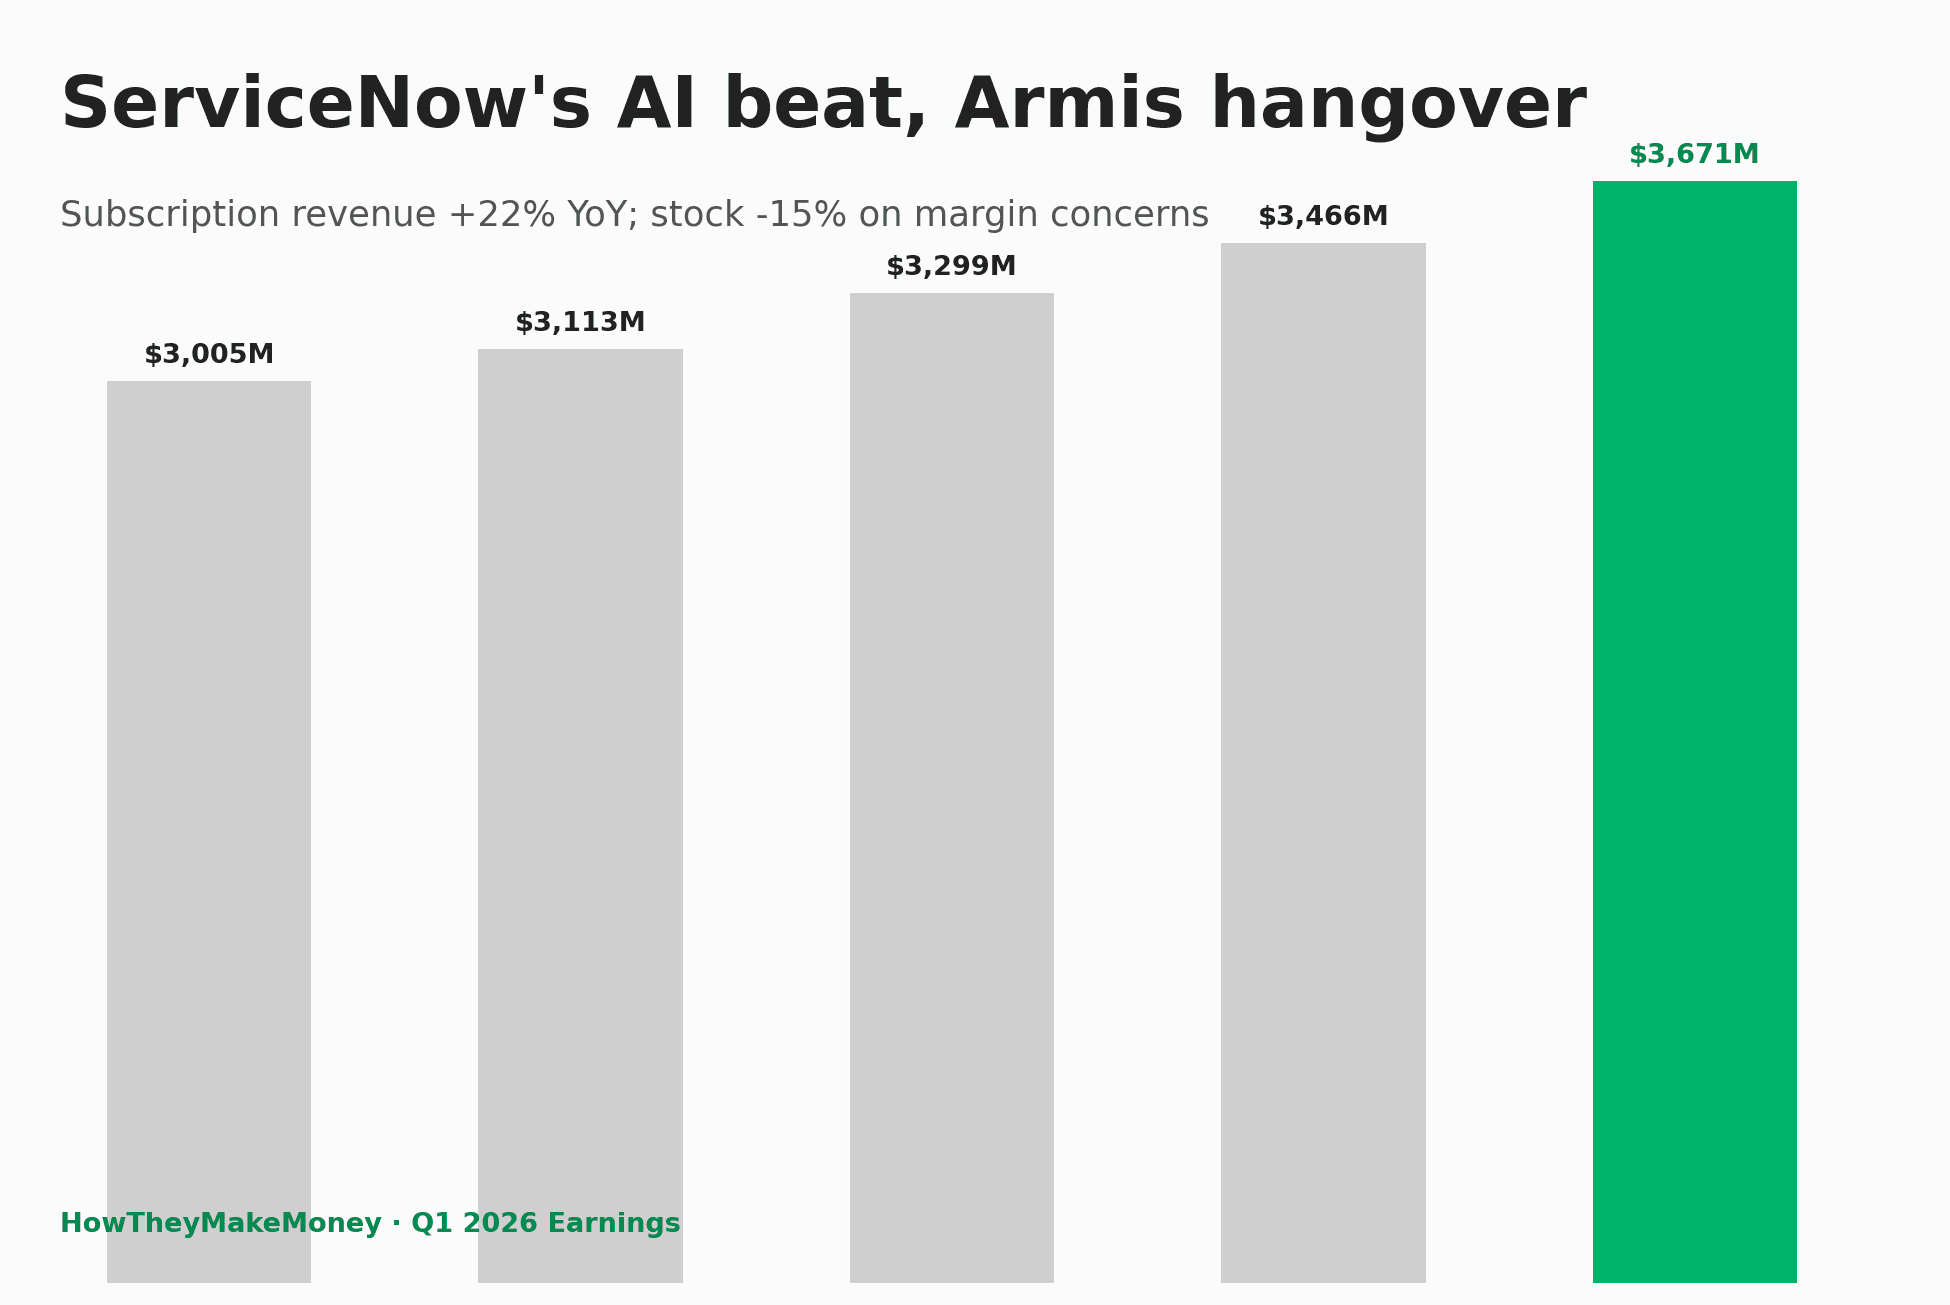
ServiceNow's Q1 2026 Was a Clean Beat. Armis, Iran, and a Federal Shutdown Took the Stock Down 15%
ServiceNow beat every topline and profitability guide in Q1 2026, raised FY26 subscription revenue guidance by $205M, and reported cRPO of $12.64B. The stock still fell 15%. Here is the reason the AI control tower narrative could not save the quarter.
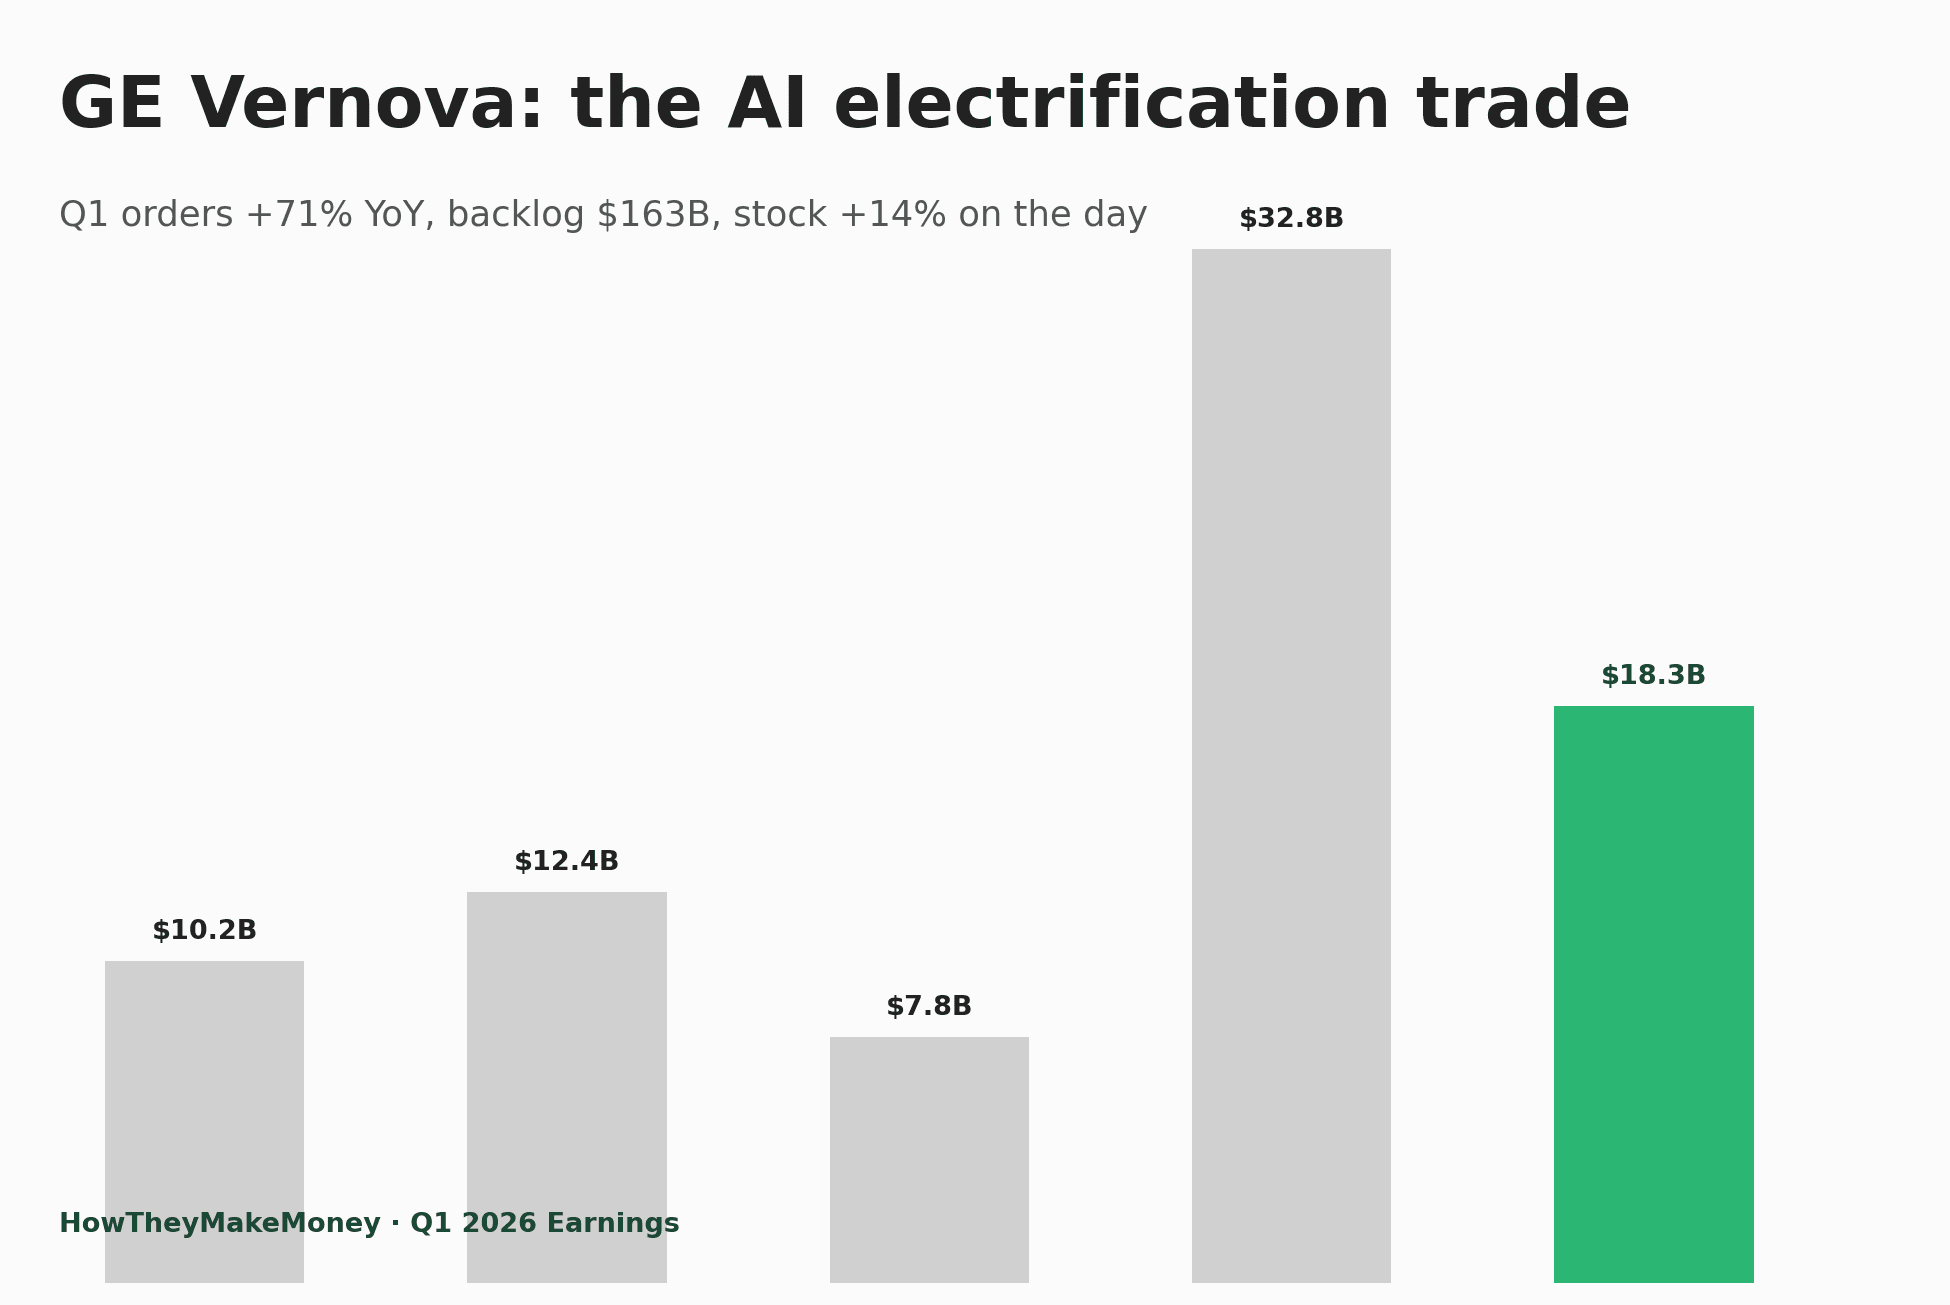
GE Vernova's Q1 2026: Orders +71%, Backlog $163B, and the $200B Target Just Moved Forward a Year
GE Vernova beat Q1 2026 on every segment, raised full-year guidance, and pulled its $200B backlog milestone forward from 2028 to 2027. Data-center electrification orders in Q1 alone exceeded the entire 2025 total. Here is why the AI power trade is not slowing down.
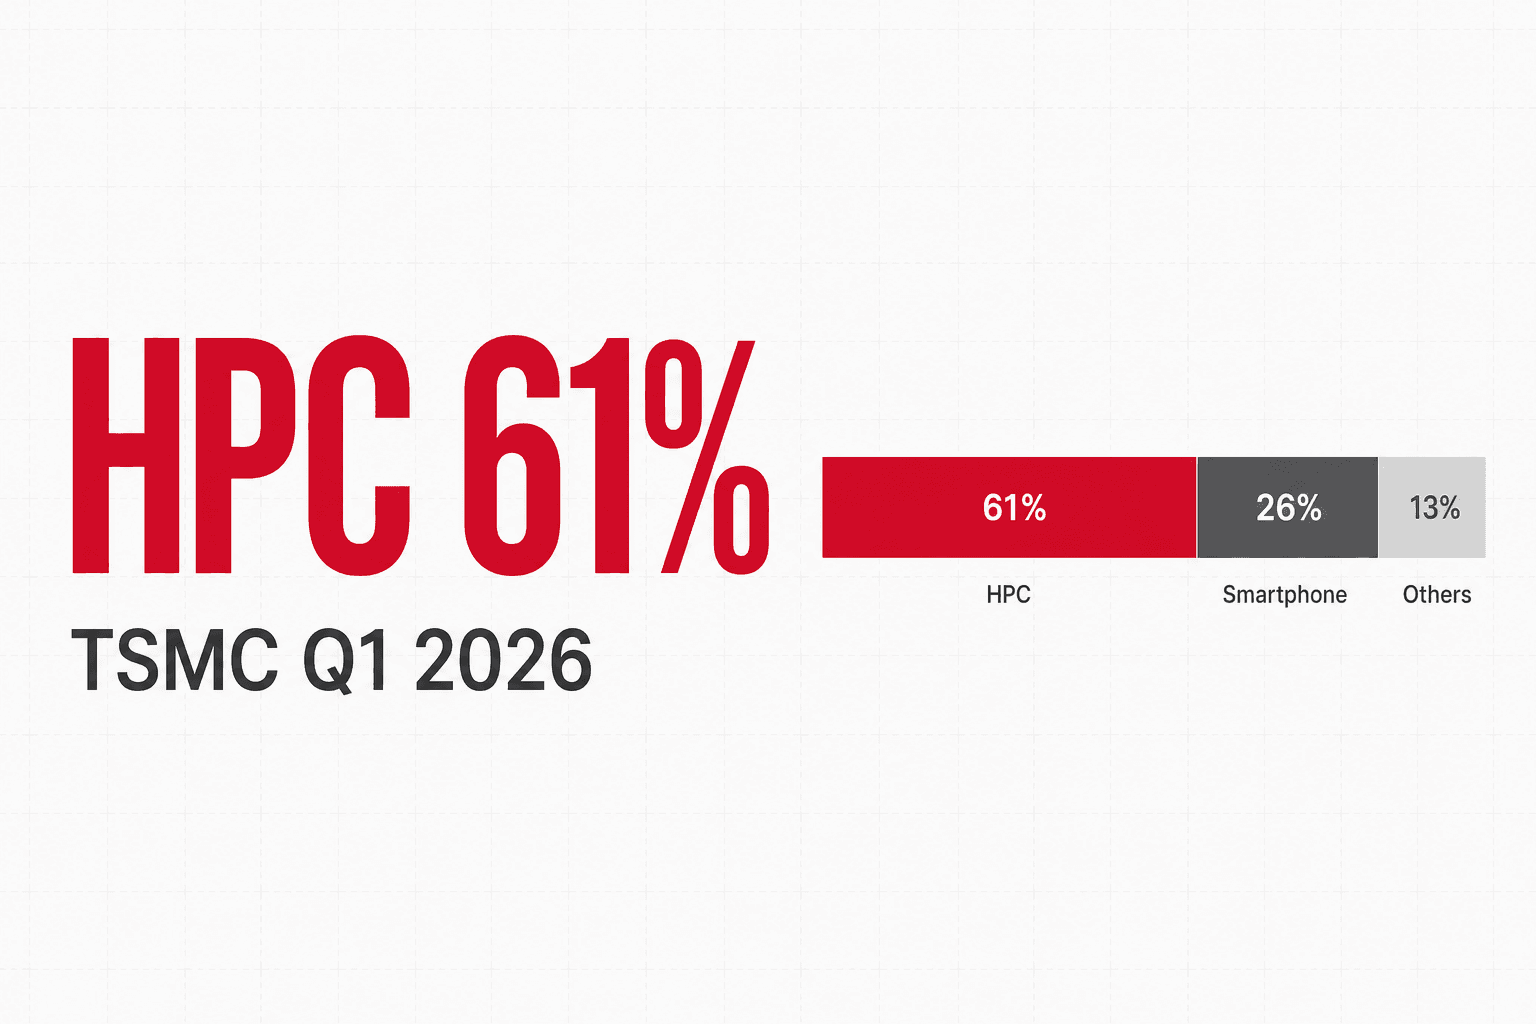
TSMC Q1 2026: HPC Mix Crosses 60% — AI Demand Finally Out-Scales the Smartphone Slump
TSMC printed NT$1,134B in revenue, 66.2% gross margin, and 58.1% operating margin — three all-time highs. But the single datapoint that resets the narrative is HPC mix jumping +8 pp QoQ to 61%. That's the first clean signal that AI demand has structurally overpowered Q1 smartphone seasonality.