Palantir's Q1 2026: A Rule of 40 Score of 145% Is Not a Software Number Anymore
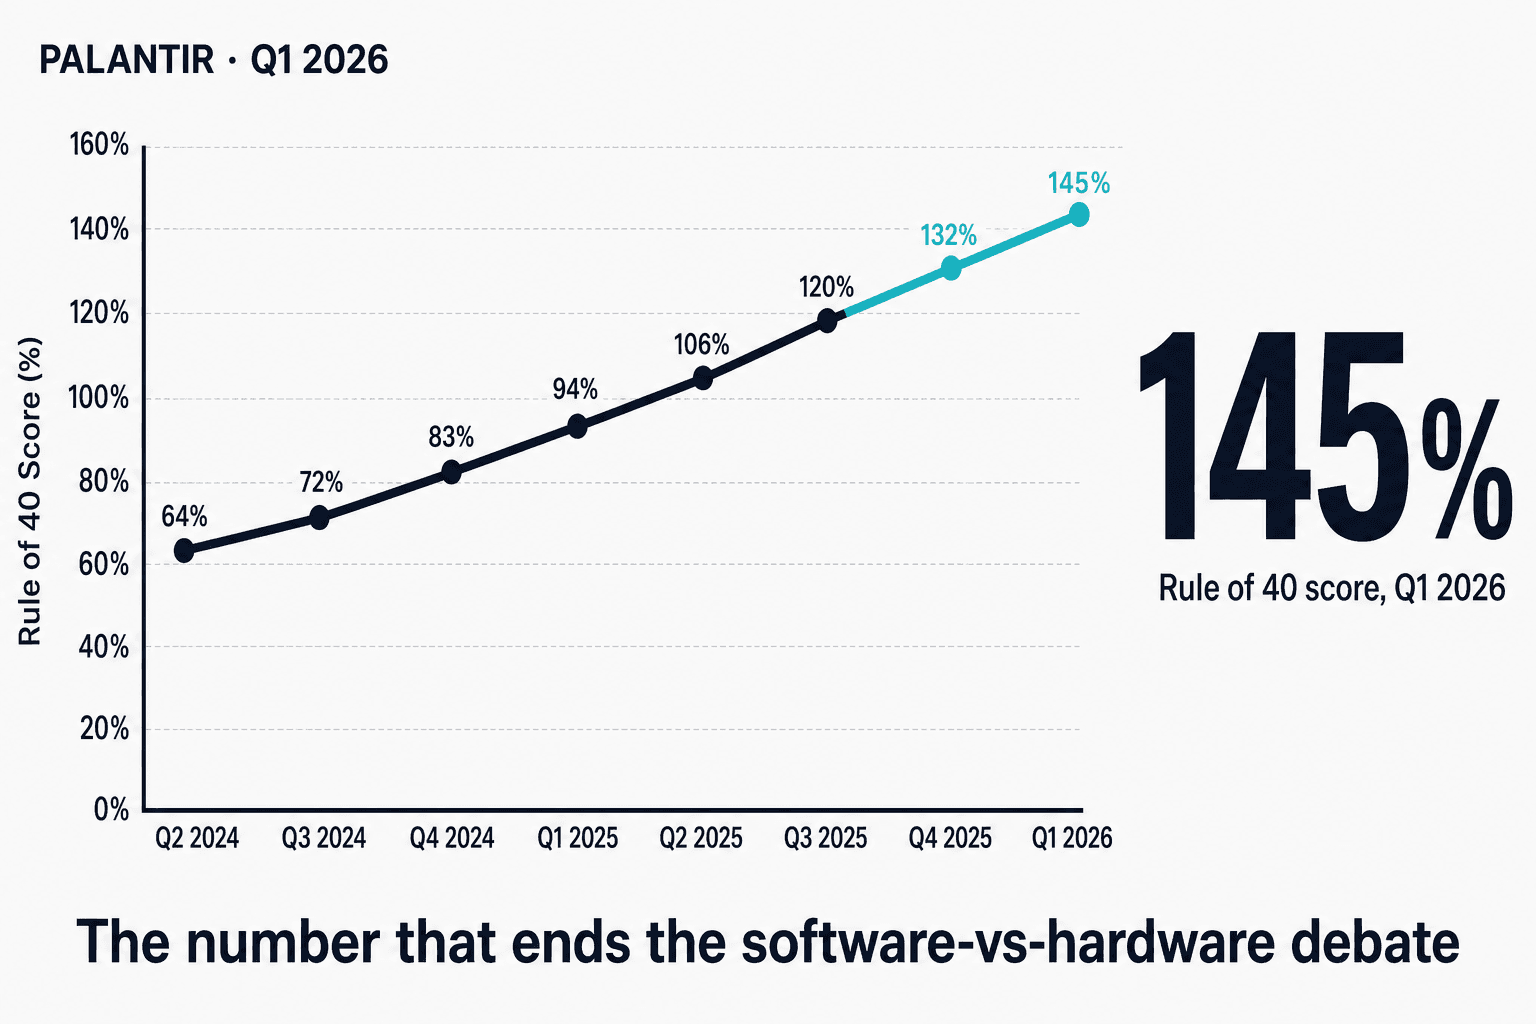
The number that made the call
Alex Karp opened Palantir's Q1 2026 earnings call by anchoring the entire narrative on one statistic: a Rule of 40 score of 145%. He repeated it. He said the comparison set was "NVIDIA, Micron, and SK hynix" — the AI infrastructure peer group, not other software companies.
That comparison is provocative on purpose. It is also, looking at the print, defensible.
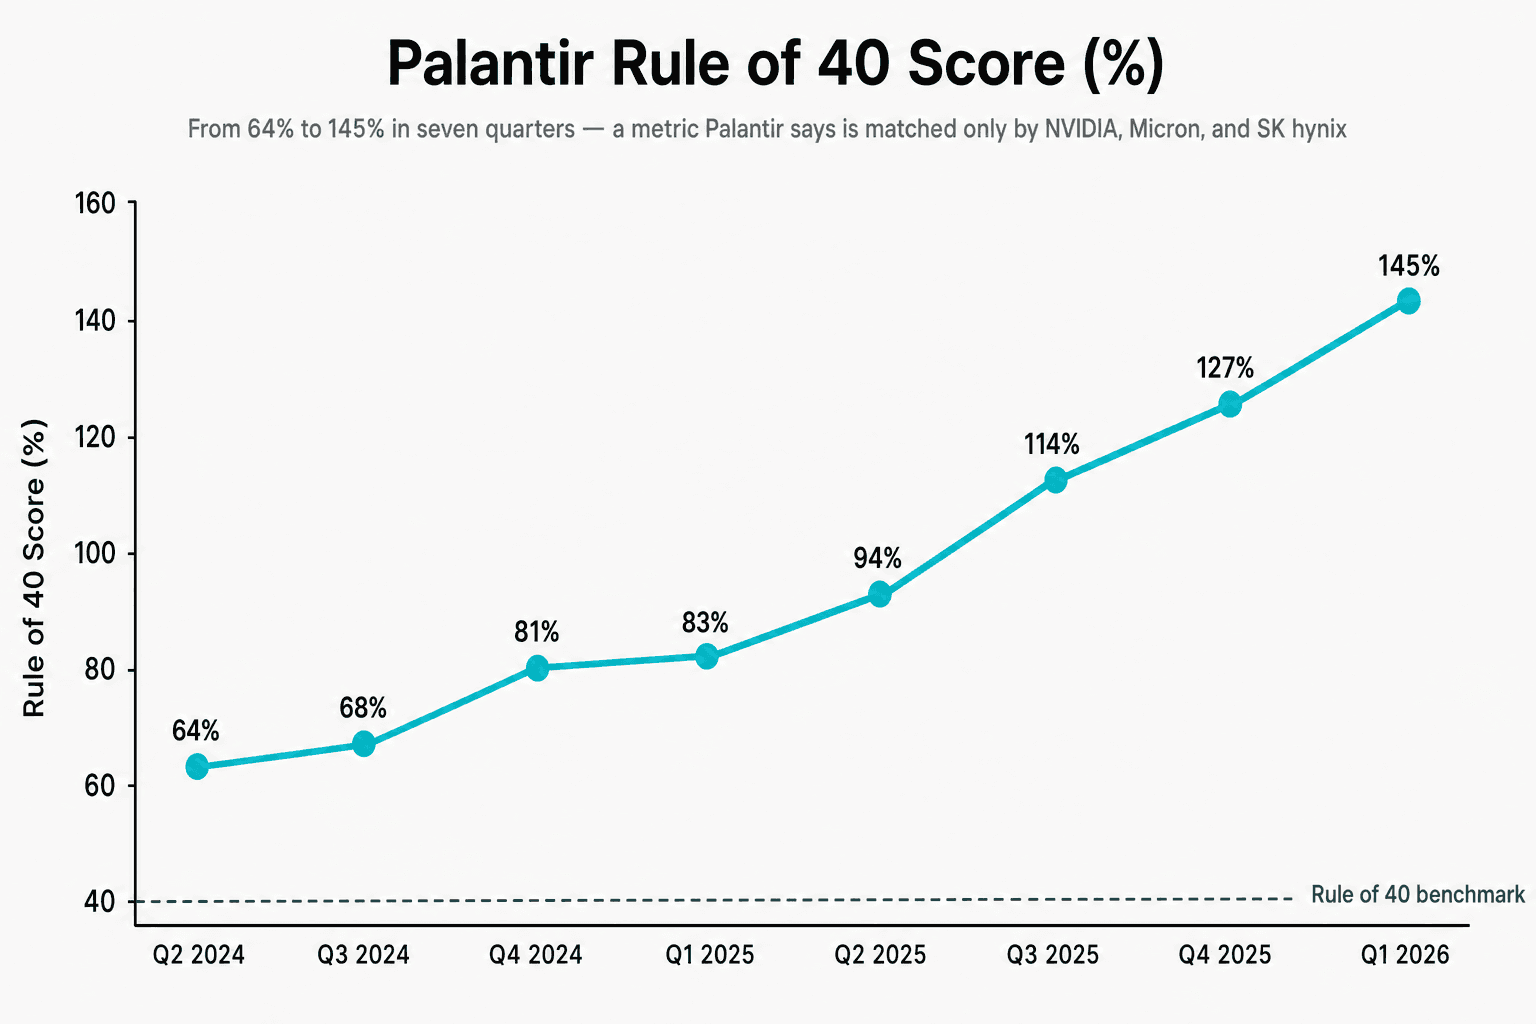
The math behind 145% is two compounding lines: revenue growth rate of 85% YoY (Palantir's fastest quarter as a public company), plus an adjusted operating margin of 60% (up from 44% a year ago). Both numbers got bigger sequentially. Both numbers got bigger faster than they did the quarter before. That is the definition of accelerating leverage at scale, and it is the thing software businesses are not supposed to do once they cross $1 billion in quarterly revenue.
The headline print, unannotated
| Metric | Q1 2026 | YoY | QoQ |
|---|---|---|---|
| Revenue | $1,633M | +85% | +16% |
| U.S. Commercial revenue | $595M | +133% | +18% |
| U.S. Government revenue | $687M | +84% | +21% |
| GAAP operating income | $754M | +328% | +31% |
| GAAP operating margin | 46% | +2,600 bps | +500 bps |
| Adjusted operating margin | 60% | +1,600 bps | +300 bps |
| GAAP EPS (diluted) | $0.34 | +325% | +42% |
| Adjusted FCF | $925M | +150% | +17% |
Every cell is the right shade of green. Revenue beat consensus by ~6%. Adjusted EPS beat by ~18%. The Q2 guide and the FY guide both came in above the Street. Even the GAAP-versus-Non-GAAP gap inverted this quarter — GAAP EPS of $0.34 was a penny ahead of Adjusted EPS of $0.33, a function of mark-to-market gains on the company's $8B cash and short-term Treasuries pile flowing through "Other income."
You do not see that very often.
U.S. Commercial: the line item the bull case lives on
If you own the stock, the chart you stare at is U.S. Commercial revenue.
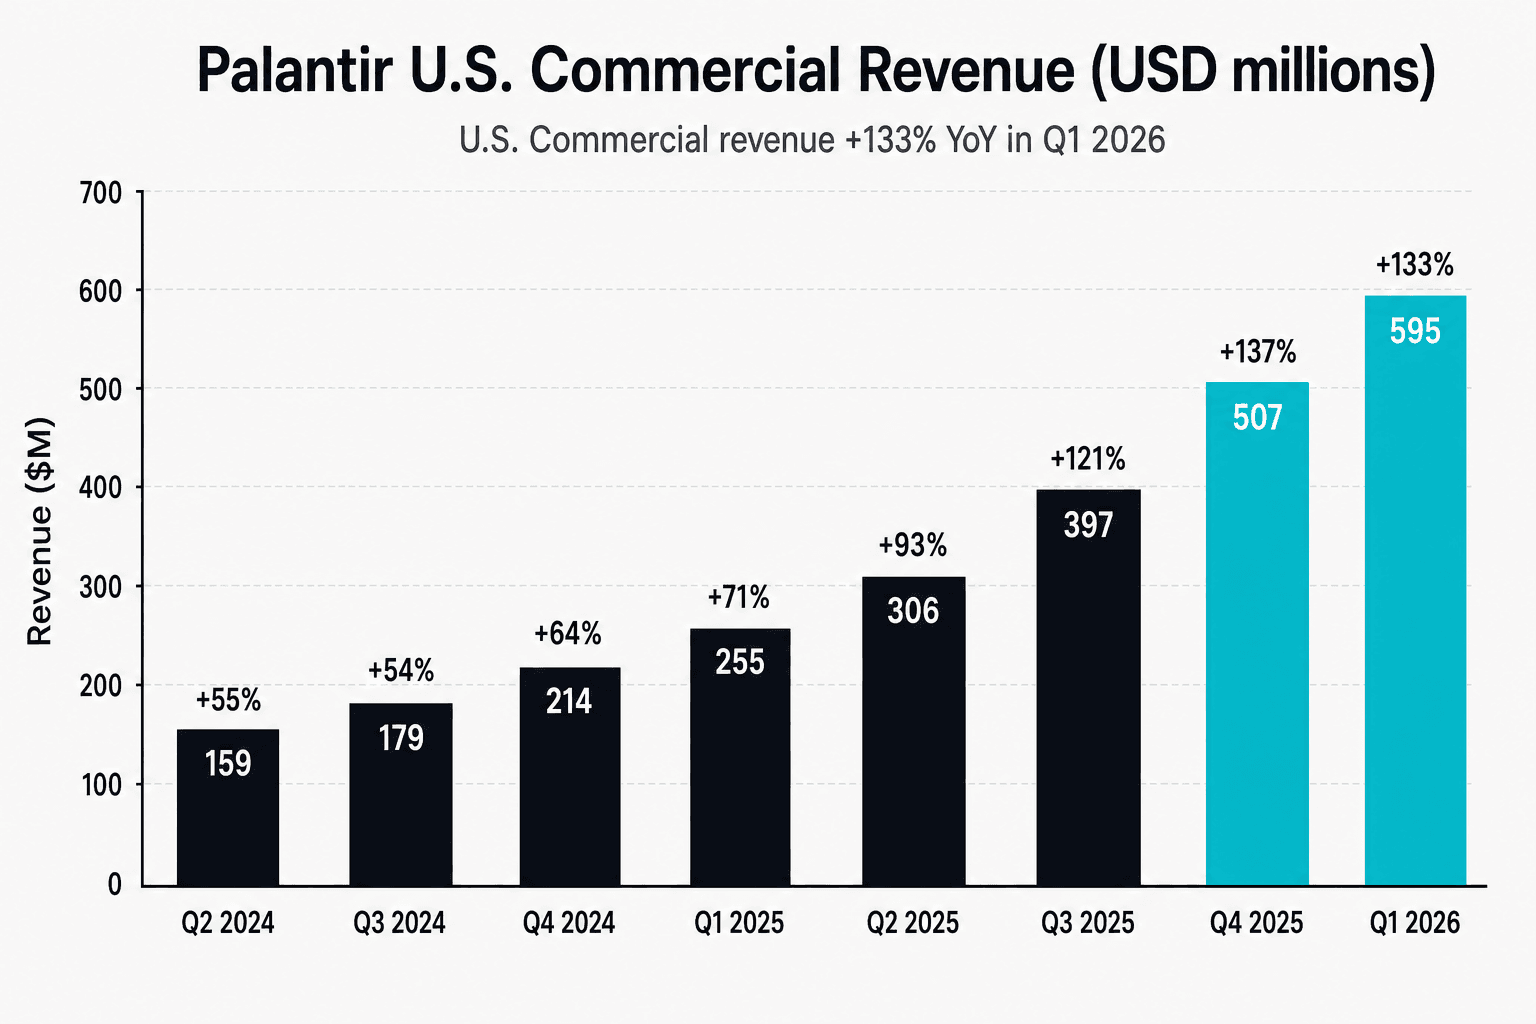
Three things are happening on that chart simultaneously. The bars are getting taller (more revenue). The labels above the bars are getting bigger numbers (faster YoY growth). And the comp base is getting harder every quarter. Q1 2026's +133% YoY is harder to print than Q2 2024's +55% — it is a much larger absolute dollar add against a much larger denominator.
The leading indicator is U.S. Commercial Remaining Deal Value (RDV), which now sits at $4.92 billion, up 112% YoY. That number is roughly 8.3x the trailing-quarter U.S. Commercial revenue run-rate, which means the visibility into 2026 and into early 2027 is built into contracts already signed. Management raised the FY 2026 U.S. Commercial revenue guide to greater than $3.224B (+120%) on the strength of that pipeline, on top of an already-raised total revenue guide.
The bear pushback is that QoQ growth in U.S. Commercial decelerated from +28% in Q4 2025 to +18% in Q1 2026. That is a real number. It is also, in absolute dollar terms, a larger sequential add than any quarter before Q3 2025.
The 85% YoY moment, in eight quarters
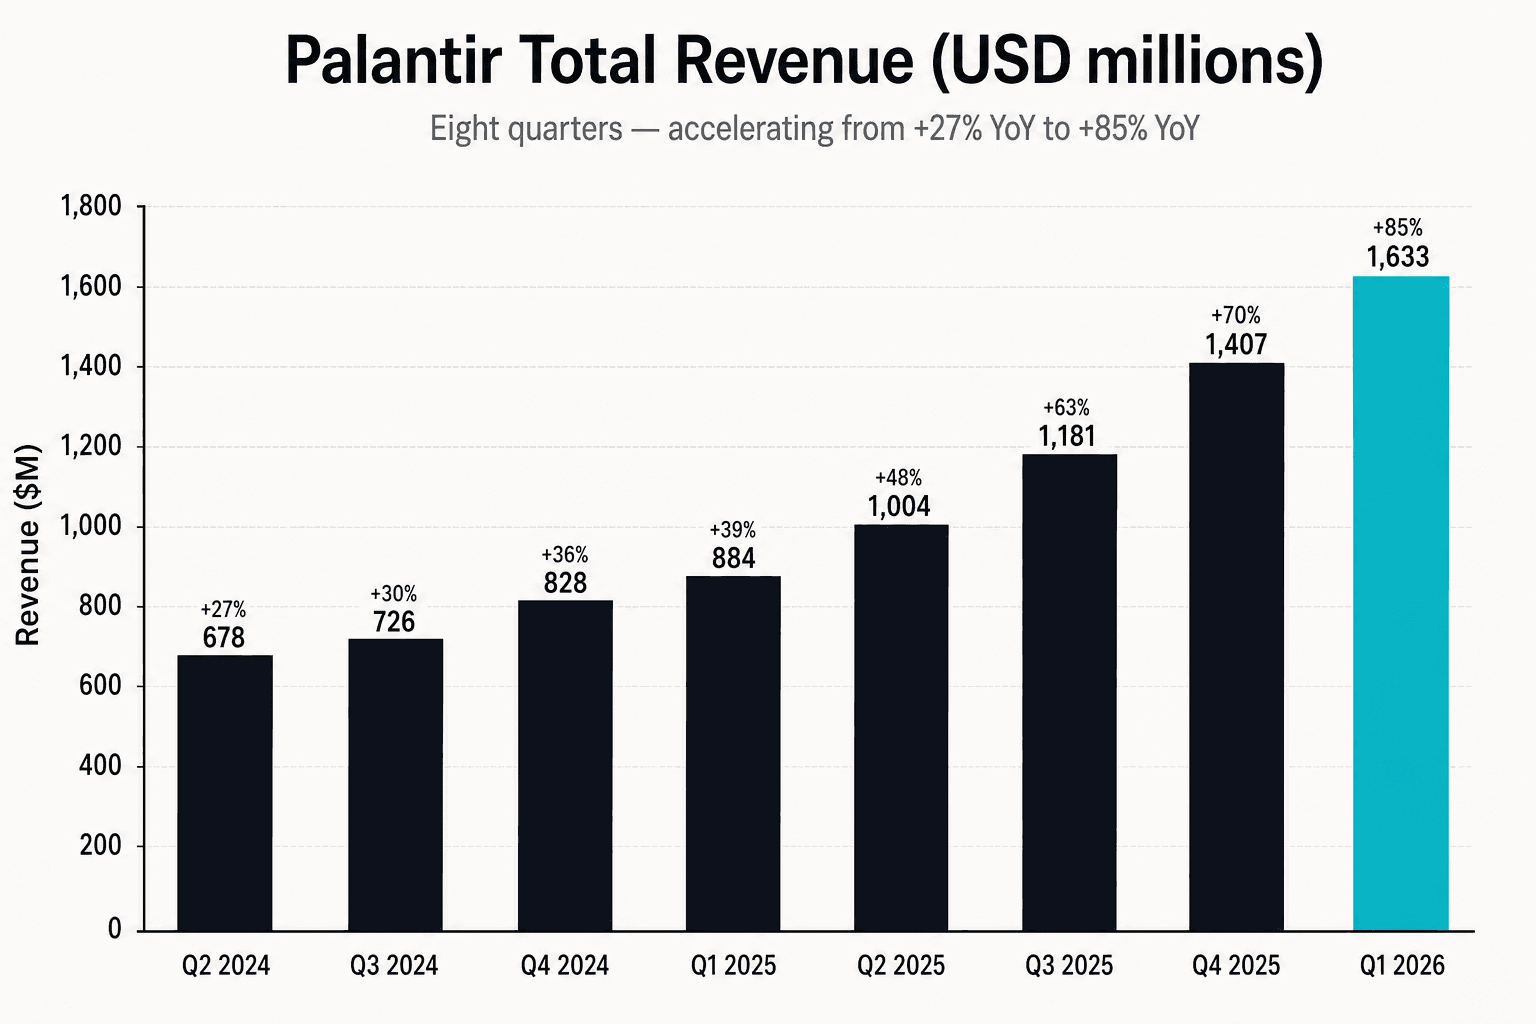
What the picture shows is uncomplicated: eleven consecutive quarters of accelerating year-over-year revenue growth. Software businesses at this revenue scale do not normally accelerate. They decelerate. The "Law of Large Numbers" was supposed to apply by now. It did not.
There is a real reason. Palantir is selling AIP — its workflow and ontology layer for enterprise AI — at exactly the moment large U.S. companies have decided they need to deploy generative models in production but cannot get the answers right with off-the-shelf foundation models alone. Karp's framing on the call was that the world had two options: "AI slop" without an ontology, or Palantir's stack with one. He used the phrase "AI slop" repeatedly.
It is provocative. It is also working.
The bear case, condensed
Three real critiques. None of them touches the operating beat.
One: the multiple. At pre-print prices, PLTR was trading at roughly 70× FY 2026 forward revenue and 120× FY 2026 forward Adjusted EPS. Even on a beat-and-raise, multiple expansion from there is asking a lot. The bull case has stopped being "the multiple goes up" and has become "the multiple holds while the revenue compounds into it." That is a different kind of bet.
Two: stock-based compensation. SBC of $202M in Q1 was 12.4% of revenue, down from 17.6% a year ago — direction good, level still elevated relative to mature SaaS norms of 6–8%. SBC growth at 30% YoY is well below revenue growth of 85%, which is structurally what bulls want to see. But the absolute level keeps getting bigger.
Three: U.S. concentration. The U.S. share of total revenue is 78% in Q1 2026, up from 71% a year ago and 64% in Q2 2024. International revenue is growing fine in absolute terms (+37% YoY) but is being lapped by the U.S. business at almost 3x the rate. Karp framed this as "AI re-industrialization of America" — a feature, not a bug. The bear reading is single-country concentration risk in a business heavily exposed to government policy.
The cleanest summary of what just happened
UBS analyst Karl Keirstead's first line in his post-print note: "We find it challenging to even find a flaw in this print."
That is unusual phrasing on Wall Street. It is also the most accurate summary of Q1 2026.
What to watch from here
Three things to watch into Q2 2026:
- U.S. Commercial QoQ growth. Q1 was +18% sequentially. If Q2 prints below ~$700M, the deceleration narrative gains traction. If it prints at or above $720M (which the guide implies), the +120% FY trajectory holds.
- The next FY guide raise. Management has raised FY 2026 revenue guide twice in three months. A third raise on the Q2 print would be the cleanest possible bull catalyst. No raise — even if Q2 itself beats — would be the cleanest possible bear catalyst.
- GAAP profitability discipline. GAAP operating margin hit 46% in Q1. The path from "good GAAP profitability" to "structural GAAP profitability" runs through SBC discipline. Watch the SBC-as-percent-of-revenue line on the Q2 deck.
The Rule of 40 score of 145% is not the answer to "is this stock a buy." It is the answer to "is this still a software company."
Karp's response, on the call, was that it might not be.