Wiwynn Q2 2026: Best Margin Ever, Worst Cash Flow Ever
The same quarter, the best margin and the worst cash flow
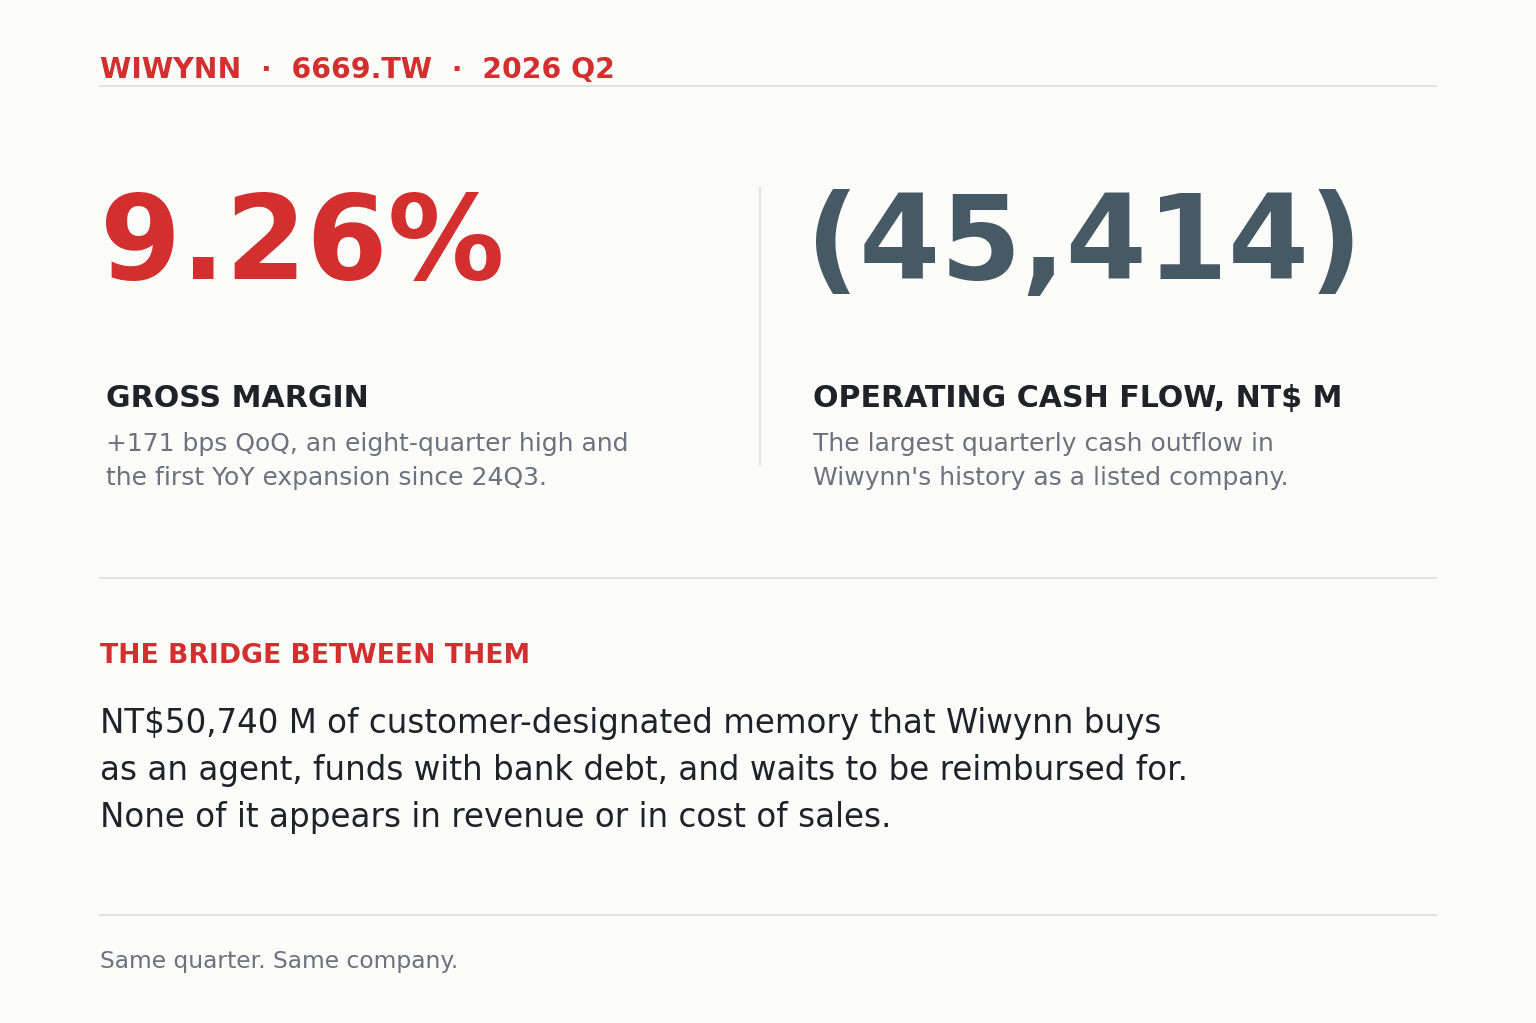
On 7 August 2026 the board of Wiwynn (6669.TW) signed off on the prettiest single-quarter income statement in the company's history. Revenue of NT$278.15 billion, up 0.59% QoQ and 26.01% YoY, a quarterly record. Gross margin of 9.26%, up 171 basis points QoQ, the highest in eight quarters and the first year-on-year improvement since Q3 2024. Net income of NT$14.97 billion and basic EPS of NT$80.43, both records too.
Turn to the cash flow statement in the same filing. Operating cash flow for the quarter was minus NT$45.41 billion. That is the largest quarterly operating outflow since Wiwynn listed: NT$29.26 billion worse than the prior quarter's minus NT$16.15 billion, and NT$54.44 billion worse than the NT$9.03 billion inflow a year earlier.
In the same 90 days, one company earned more than it ever has and bled more cash than it ever has. That is not a coincidence. The two are opposite ends of the same thing.
Two reading conventions, stated up front. First, all amounts are in New Taiwan dollars. The company reports in millions; figures here are shown in NT$ billion where the scale warrants, at NT$1 billion = NT$1,000 million. Second, Wiwynn went ex-rights on 2 September 2026, paying a stock dividend of 1.9827946 shares on every share held. One share became 2.98279460 shares, the per-share price was adjusted down in the same proportion, and the total value of a holding was unchanged. Every share price and broker target price in this article is stated on a post-ex-rights basis, with the original pre-ex-rights quote in brackets where it helps. EPS is quoted as reported, on the pre-ex-rights basis, with the retroactively adjusted figure supplied wherever it has to sit next to a share price.
The memory moved off the income statement
Wiwynn's own explanation runs to two sentences. In a written statement on 7 August the company said that since April the memory for some customers has been bought on an agent basis; that the amounts involved are excluded from both revenue and cost of sales; and that this, together with higher NRE income from new product introductions in Q2, lifted quarterly gross margin to 9.3% (Liberty Times Finance, Economic Daily News).
In plain English: the customer picks the memory vendor and the price, and Wiwynn places the order, pays for it, installs it and ships it. Because Wiwynn never really takes control of that memory before delivery, the revenue recognition policy in the consolidated financial statements treats Wiwynn as an agent rather than a seller. The money therefore leaves revenue and cost of sales at the same moment.
Memory is one of the least markup-friendly components in a server. Take something close to zero-margin out of the numerator and the denominator at once and gross margin, a ratio, looks better, while the gross profit the company actually earns, an amount, does not rise by a single dollar. It is also why April revenue fell 16.14% month on month while the company said rack shipments were in fact up.
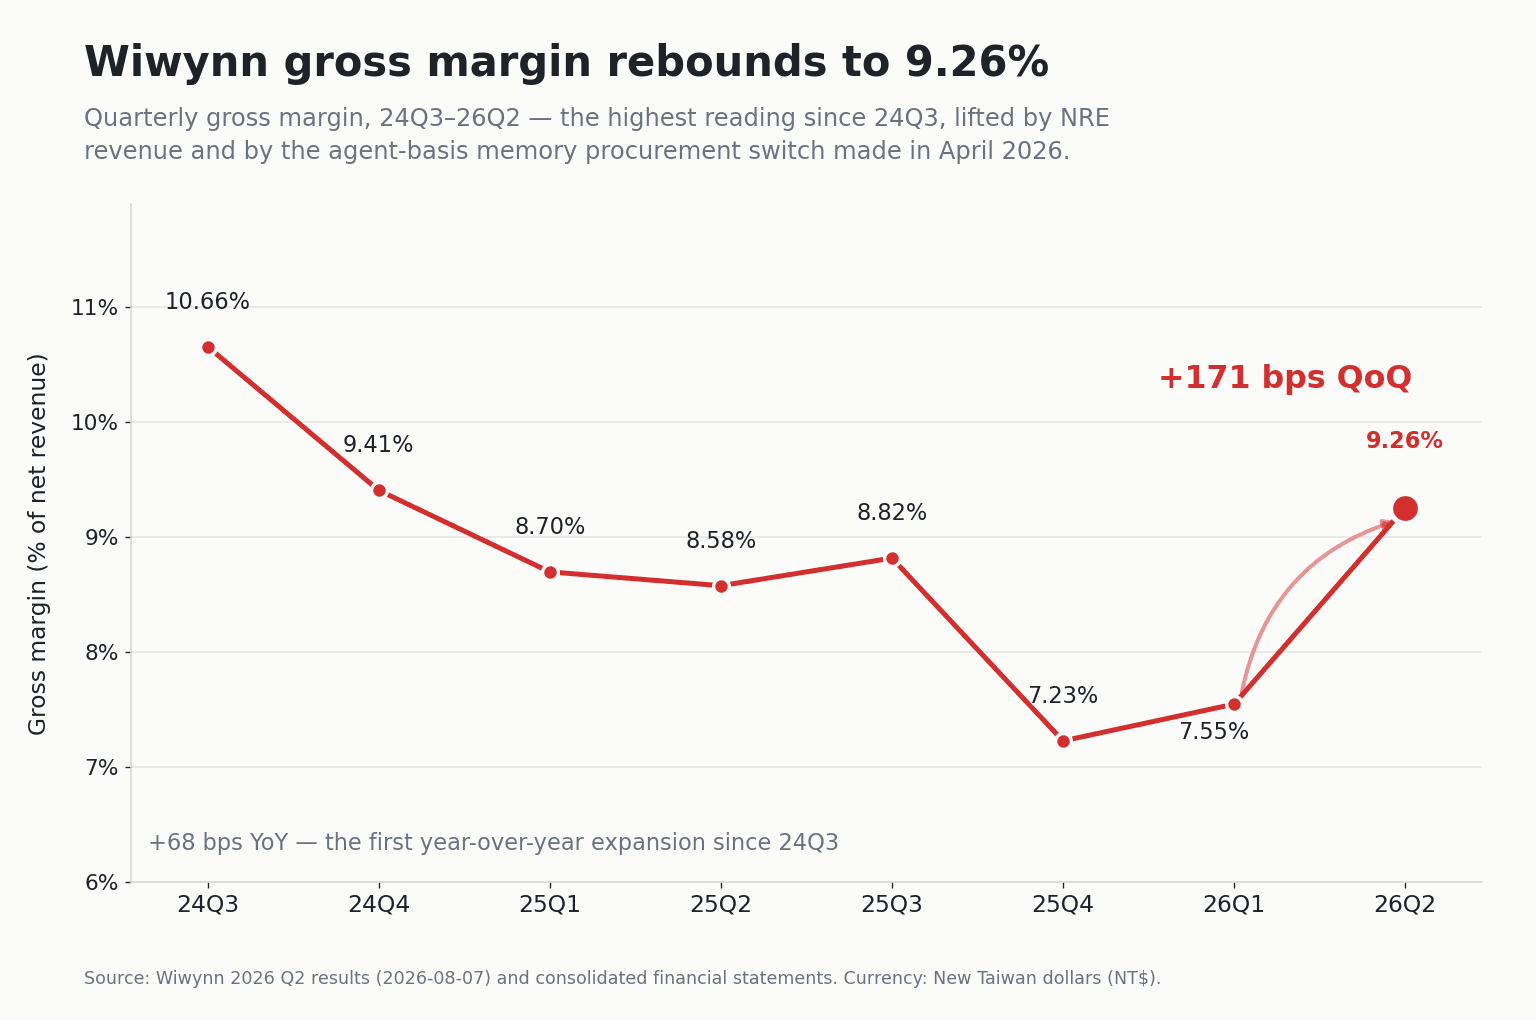
That reading on its own is too easy, though. Gross profit in the quarter was NT$25.76 billion, up 23.38% QoQ, which is real growth and not merely arithmetic. The company attributes the difference to NRE, the engineering fees charged to customers during new product introduction. A second line on the income statement backs the claim up.
R&D doubled in a single quarter
Operating expenses of NT$5.55 billion, up 61.99% QoQ, were the most violent move on the income statement, and the results deck offered not a word of explanation. Break it open: R&D of NT$4.08 billion, up 99.27% QoQ and 120.71% YoY. R&D alone accounts for NT$2.03 billion of the NT$2.12 billion increase in quarterly operating expenses, or 95.8% of it.
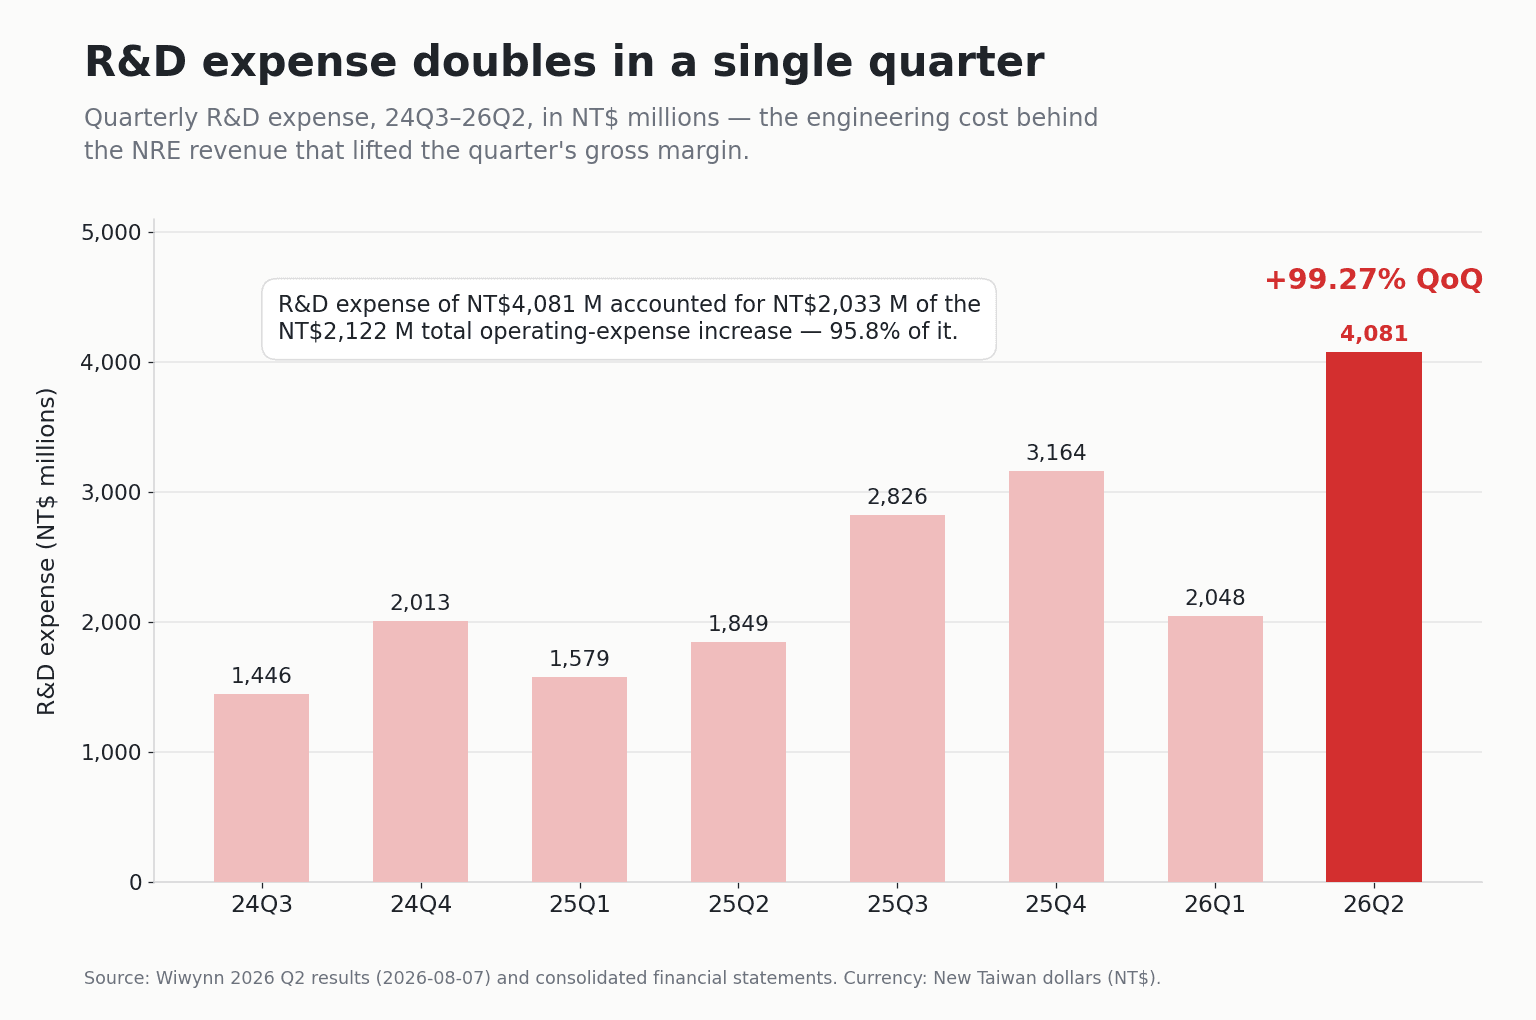
NRE income lands in gross profit; the engineering cost of earning it lands in R&D. Both lines moved in the same quarter. That makes the NRE explanation credible rather than merely convenient. The catch is that NRE is one-off by nature and swings with the project calendar, and management's own language stays deliberately cautious: with a rising ASIC mix and a shifting product mix in the second half, gross margin should show "little change", though the contribution from NRE still needs watching (Anue). That last caveat is the point.
The bill did not disappear, it changed address
Agent-basis procurement moved the memory off the income statement. It did not move it off the balance sheet. Wiwynn still pays for the parts up front and waits for the customer to reimburse it.
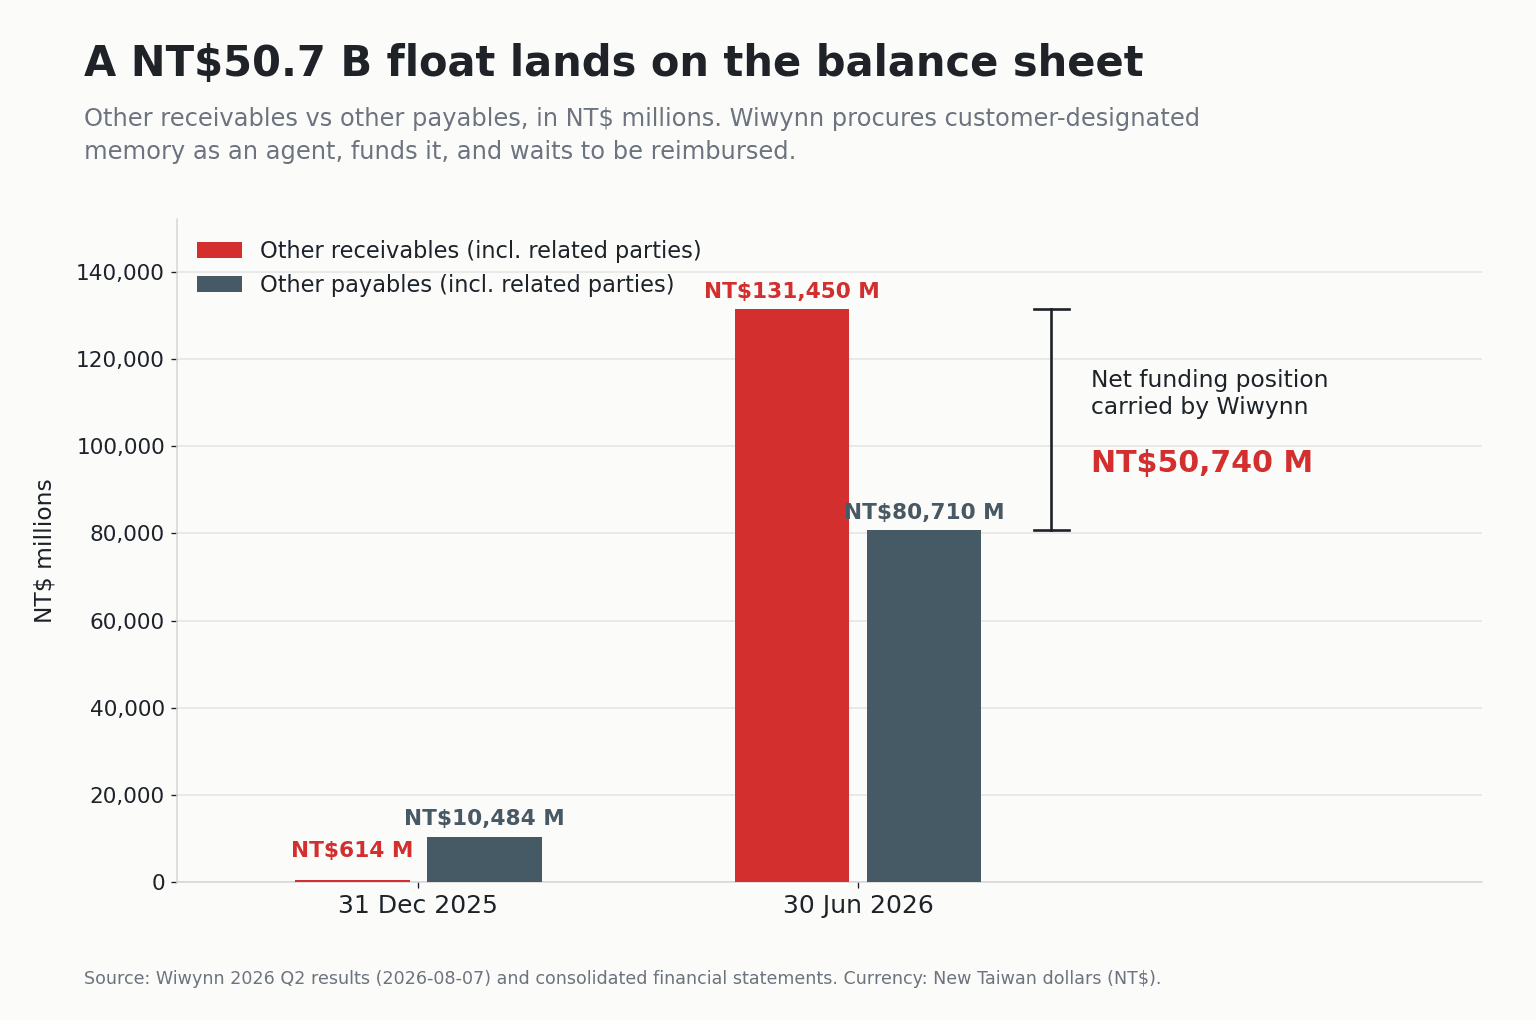
Other receivables went from NT$614 million at end-2025 to NT$131.45 billion at 30 June 2026. Other payables rose over the same span, from NT$10.48 billion at end-2025 to NT$80.71 billion at 30 June 2026. Both lines are combined figures including related parties. The NT$50.74 billion net gap between them at 30 June is money Wiwynn has fronted on its customers' behalf. The technical term is float: the capital stuck between paying out and collecting. The cash flow statement carries the matching entry, an increase in other receivables of minus NT$130.17 billion for the first half, against just minus NT$544 million in the same period last year.
Almost all of that float appeared inside a single quarter. At end-March 2026 these two lines still netted to a payable of minus NT$9.99 billion (other receivables NT$428 million, other payables NT$10.42 billion, same combined basis including related parties), meaning customer money was sitting with Wiwynn rather than the reverse. Three months later Wiwynn had NT$50.74 billion sitting with its customers. The whole direction reversed in 90 days.
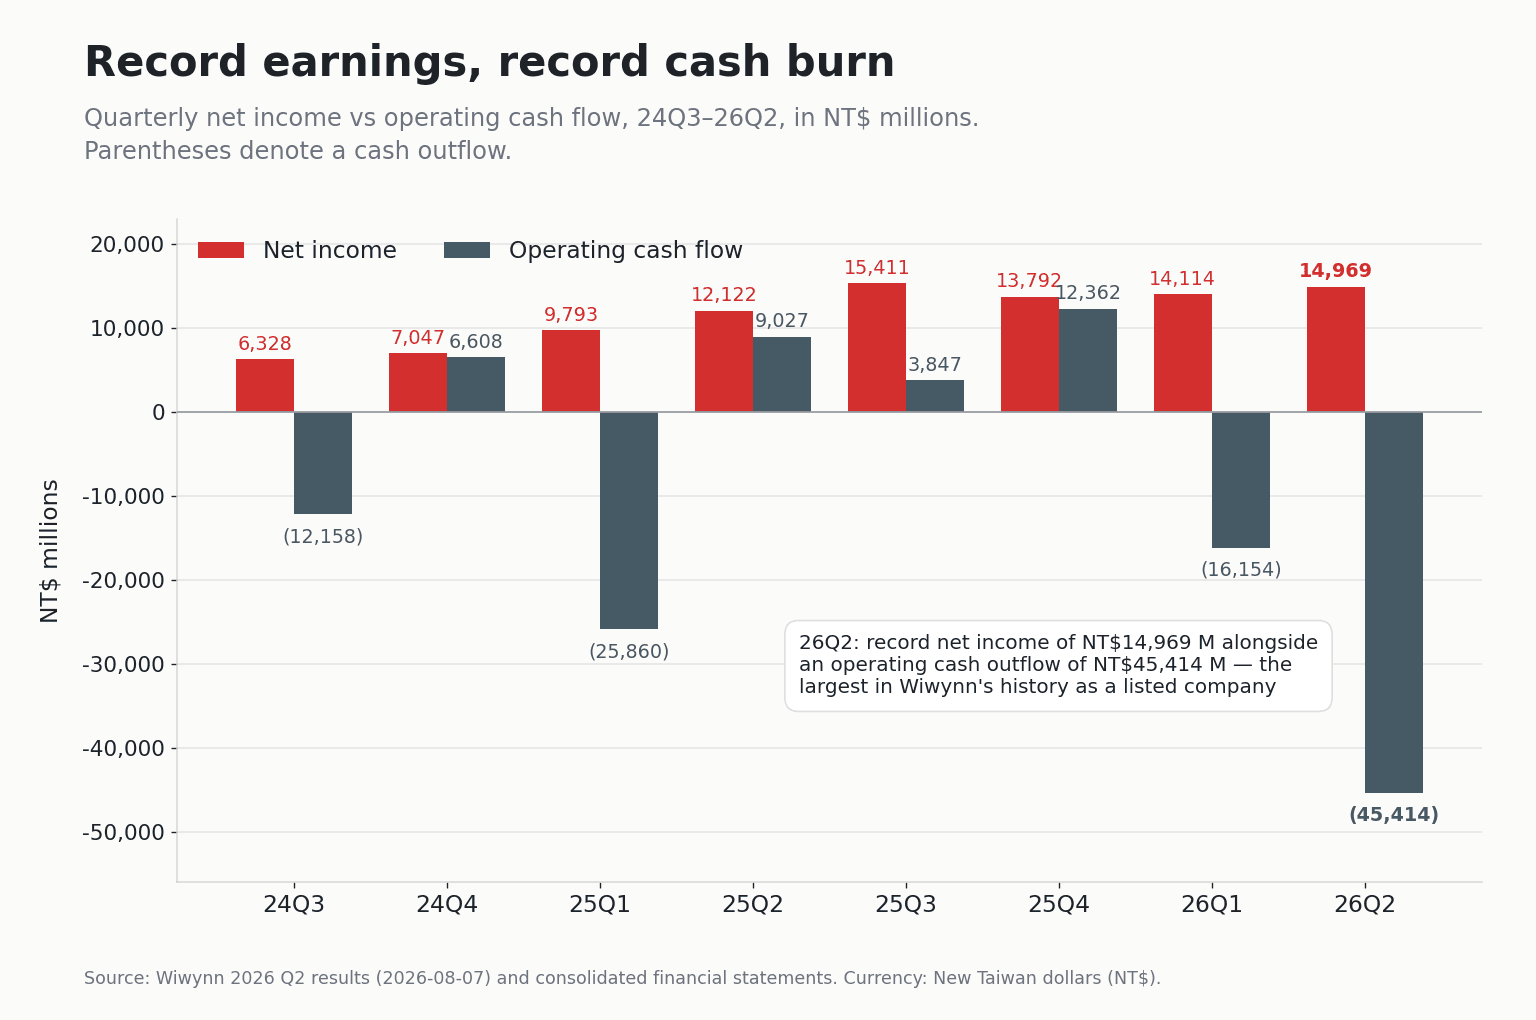
Somebody has to fund that. Bank borrowings stood at NT$76.62 billion at 30 June, up 100.14% YoY, and Wiwynn issued NT$63.73 billion of convertible bonds in the first half. The result shows up in interest. Finance costs of NT$2.06 billion for the quarter, up 52.48% QoQ and 223.43% YoY, pushed non-operating items to a NT$1.24 billion loss. So operating income rose 15.81% QoQ while pre-tax income rose only 5.80%.
The same gap reads more cleanly in margins. Gross margin up 171 basis points QoQ. Operating margin up 95. Net margin up 28. What evaporated in between is the carrying cost of the float. The conclusion is not hard to write: agent-basis procurement moved roughly 171 basis points of reported gross margin off the income statement and onto the balance sheet and the interest line.
Across this entire cycle of Chinese-language coverage, not one Taiwanese outlet connected agent-basis procurement to its balance sheet consequences. At the 10 September briefing, management did not raise operating cash flow, other receivables or finance costs, and no reporter asked. Nothing here is fabricated. Every number sits in the public consolidated financial statements. Nobody turned to that page.
And one thing the market has backwards: the AI mix went down
The default picture of Wiwynn is an AI share that only climbs. The first half of 2026 was not that. Management's account on 10 September: first-half shipments were mostly general-purpose servers; general-purpose and ASIC would not draw level, at roughly half and half, until Q3; ASIC would not overtake general-purpose until Q4; GPU servers would not begin shipping until the very end of Q4; and for the full year, the AI server and ASIC share still will not exceed 50% (Liberty Times Finance). AI was above half at the end of 2025, so this is a downgrade, not an upgrade.
Agent-basis procurement, meanwhile, was explicitly described as mainly used on general-purpose server projects. The product line that shipped the most this half is the same one taken out of the revenue line. Revenue up just 0.59% QoQ while gross margin jumped 171 basis points: most of the explanation is right there.
One more number worth writing down. The credit concentration note in the consolidated financial statements shows the top three customers at 99.18% of accounts receivable at 30 June, the highest in eight quarters and up for a second consecutive quarter. That is receivables concentration, not revenue concentration, so treat it as a directional indicator only. The direction is unambiguous: Wiwynn is getting more concentrated, not less.
The market took five weeks to put a price on it
Barely a flicker on the day. On 10 August, the first session after the results, Wiwynn opened up 1.89% and closed down 1.48%, on volume of only 0.85 times the prior 20-session average. The same day Quanta (2382.TW) rose 5.20%, Wistron (3231.TW) rose 5.18%, and the TAIEX rose 1.59%. On the one day when its own results were the biggest story it had, Wiwynn was the only stock in the whole AI server group to fall.
The real re-rating came over the following three weeks, and not from the filing: earnings estimate upgrades, the 14 August capacity announcement, and positioning ahead of the ex-rights date. Wiwynn closed 1 September at NT$2,615.0 on a post-ex-rights basis (NT$7,800 pre-ex-rights), up 27.87% from the results date. Roughly a third of that has since been given back, with the 14 September close at NT$2,270. Measured from the adjusted results-day price of NT$2,045.1, the period return is +11.00%, against +3.70% for the TAIEX.
The sell side, for its part, is unanimous. No public downgrade or target cut has surfaced since 7 August, and four named houses have all either maintained a buy or raised their target. Goldman Sachs targets NT$3,353 (NT$10,000 pre-ex-rights), Fubon NT$2,917 (NT$8,700 pre-ex-rights), and UBS NT$2,464 in its 8 September note (NT$7,350 pre-ex-rights). The FactSet-adjusted consensus target is NT$2,715.57, about 19.6% above the 14 September close. All of those are post-ex-rights figures. The most conservative named view comes from President Securities, at NT$340.95 for 2026 EPS, roughly 5.6% below the consensus median (via CMoney).
One footnote. Wiwynn holds no quarterly earnings call of its own; its annual analyst meeting is in February. This quarter's deck was presented on 10 September by CFO Harry Chen at the KGI Securities third-quarter investment forum, and the UBS Taiwan forum on 16 September runs the same deck. A company that earned NT$14.97 billion in a single quarter gets its quarterly explanation to the market only through events other people organise. That arrangement says something on its own.
Three things to watch
One: whether the float keeps growing. The second-half capex budget is US$942 million, about 2.5 times the NT$11.85 billion spent in the first half, and the company is spending it while burning NT$45.41 billion of operating cash a quarter. On 7 August, the same day, the board approved up to NT$15 billion of domestic convertible bonds and a US$1.5 billion syndicated loan. The funding is arranged. It also means the interest line goes up again.
Two: whether the gross margin holds. The agent-basis effect is a one-time reset, with no new comparative benefit from the same quarter next year. NRE jumps around with the project calendar. Management says second-half gross margin shows "little change", conditional on NRE continuing to contribute.
Three: whether the Q4 mix actually crosses. ASIC overtaking general-purpose and GPU servers beginning to ship are both scheduled for Q4. July revenue was NT$117.69 billion and August NT$144.31 billion, with YoY growth accelerating from +39.23% to +50.36%. Both are monthly records, and both were achieved on the smaller revenue definition. The underlying business really is accelerating. The income statement currently shows only part of it.