Alchip Q1 2026: Revenue Down 58% YoY, Gross Margin Breaks 50% for the First Time
A quarter where revenue and earnings stopped agreeing with each other
Alchip's Q1 2026 revenue print is US$132.4M — down 13% QoQ, down 58.5% YoY, the lowest quarter in eight. Read in isolation, that's a number that should be bad: the production cycle has hit its trough, compounded by a single project's tape-out slipping out of the quarter into Q2.
But the same earnings release also has gross margin at 50.2% — the first time above 50% in company history, eight points higher than last quarter and 26 points higher than a year ago.
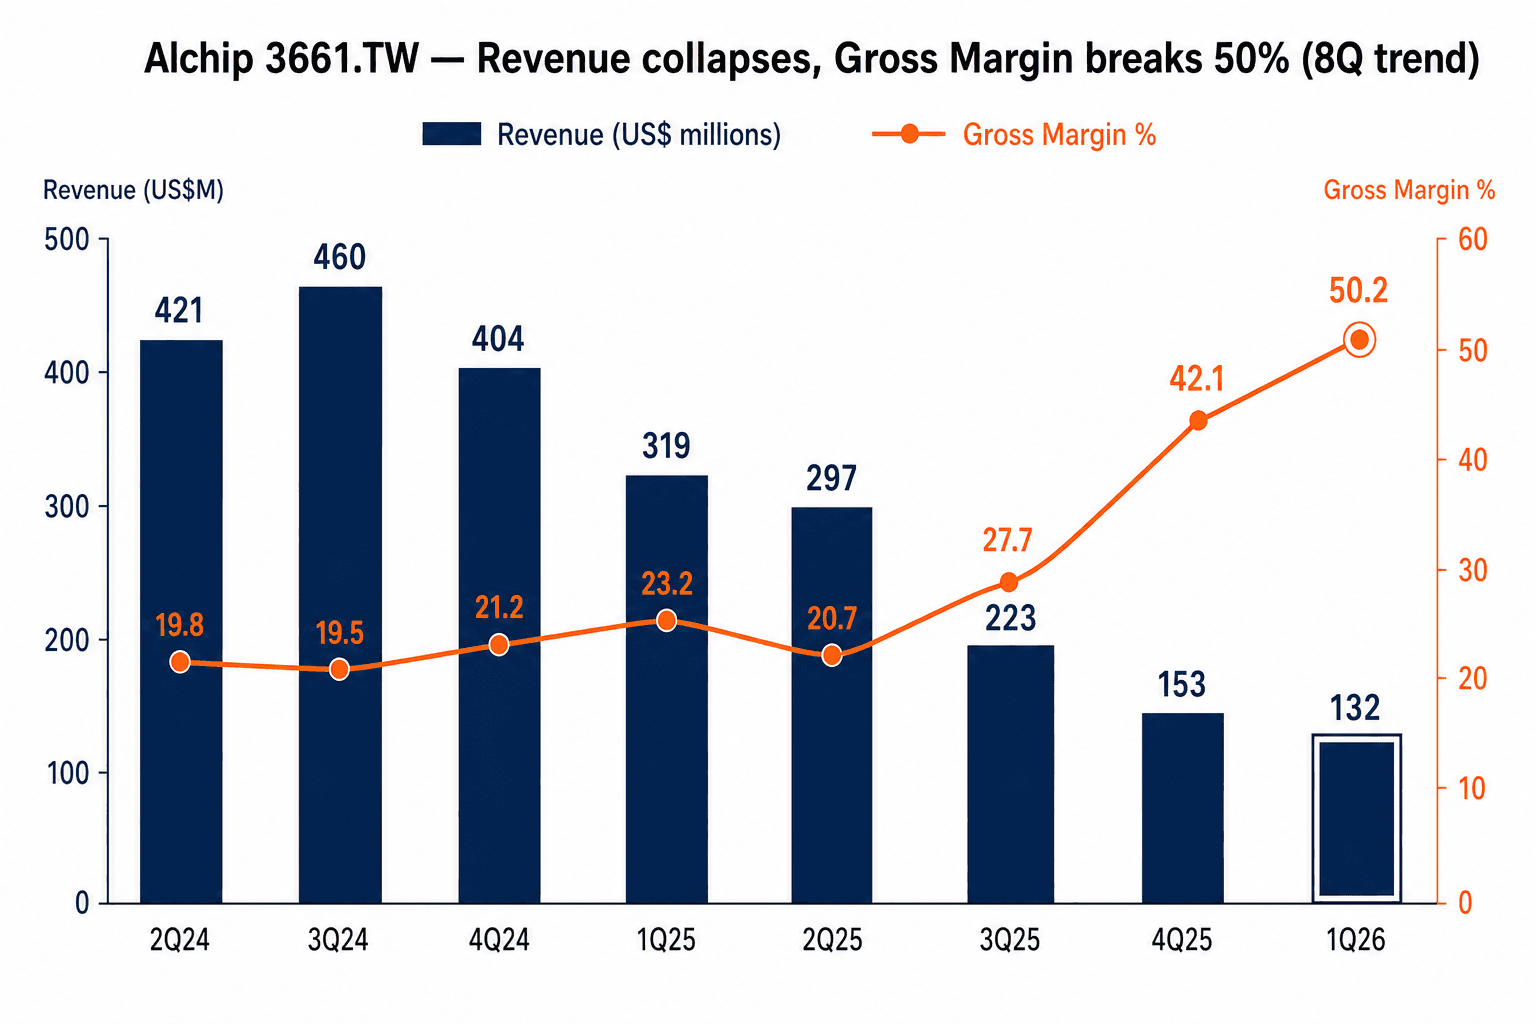
Put both readings on one chart and the entire Q1 2026 story is on the page: revenue at the floor of the production-cycle trough, gross margin at an all-time high because the product mix has flipped to NRE-dominant. Net income closed at US$45.1M — down 6% QoQ, up 1.6% YoY. A quarter where revenue fell 58% YoY and net income grew. That's not a shape from any earnings textbook.
NRE is the protagonist of this quarter
To read this print, you have to know how Alchip's revenue actually splits.
NRE (Non-Recurring Engineering): customers contract Alchip to design ASICs. Revenue gets recognized at project milestones — spec lock, tape-out, validation. NRE carries high margin. In the 3Q25 call management disclosed NRE was 30–40% of revenue at the time, lifting blended gross margin to 28%.
Production: once a chip is designed, Alchip runs the turnkey production package — wafer at TSMC, advanced packaging, test, yield engineering — and earns a service margin. Production gross margin historically lands high-teens to mid-20s, depending on program.
When the North American IDM customer's 5nm AI accelerator program reached end-of-life in 3Q25, the single largest Production engine shut off. The revenue path from 4Q24 to 1Q26 — US$404M → US$319M → US$297M → US$223M → US$153M → US$132M — is essentially the trace of that engine winding down.
The NRE engine kept running. Because NRE is spread across many customers and the N3 / N2 design pipeline remains "very strong" in management's words, NRE dollars stayed roughly flat while Production dollars fell. The mechanical result: NRE share of total mix kept rising.
Gross margin's climb from 19.5% (2Q24, Production-dominant) to 50.2% (1Q26, NRE-dominant) is the visualization of that mix shift. Back-solve from a 50%+ gross margin and Q1 NRE share is plausibly above 60% — the first quarter in this company's history where the revenue mix is "half NRE, half Foundry-services."
Earnings have nearly fully decoupled from revenue
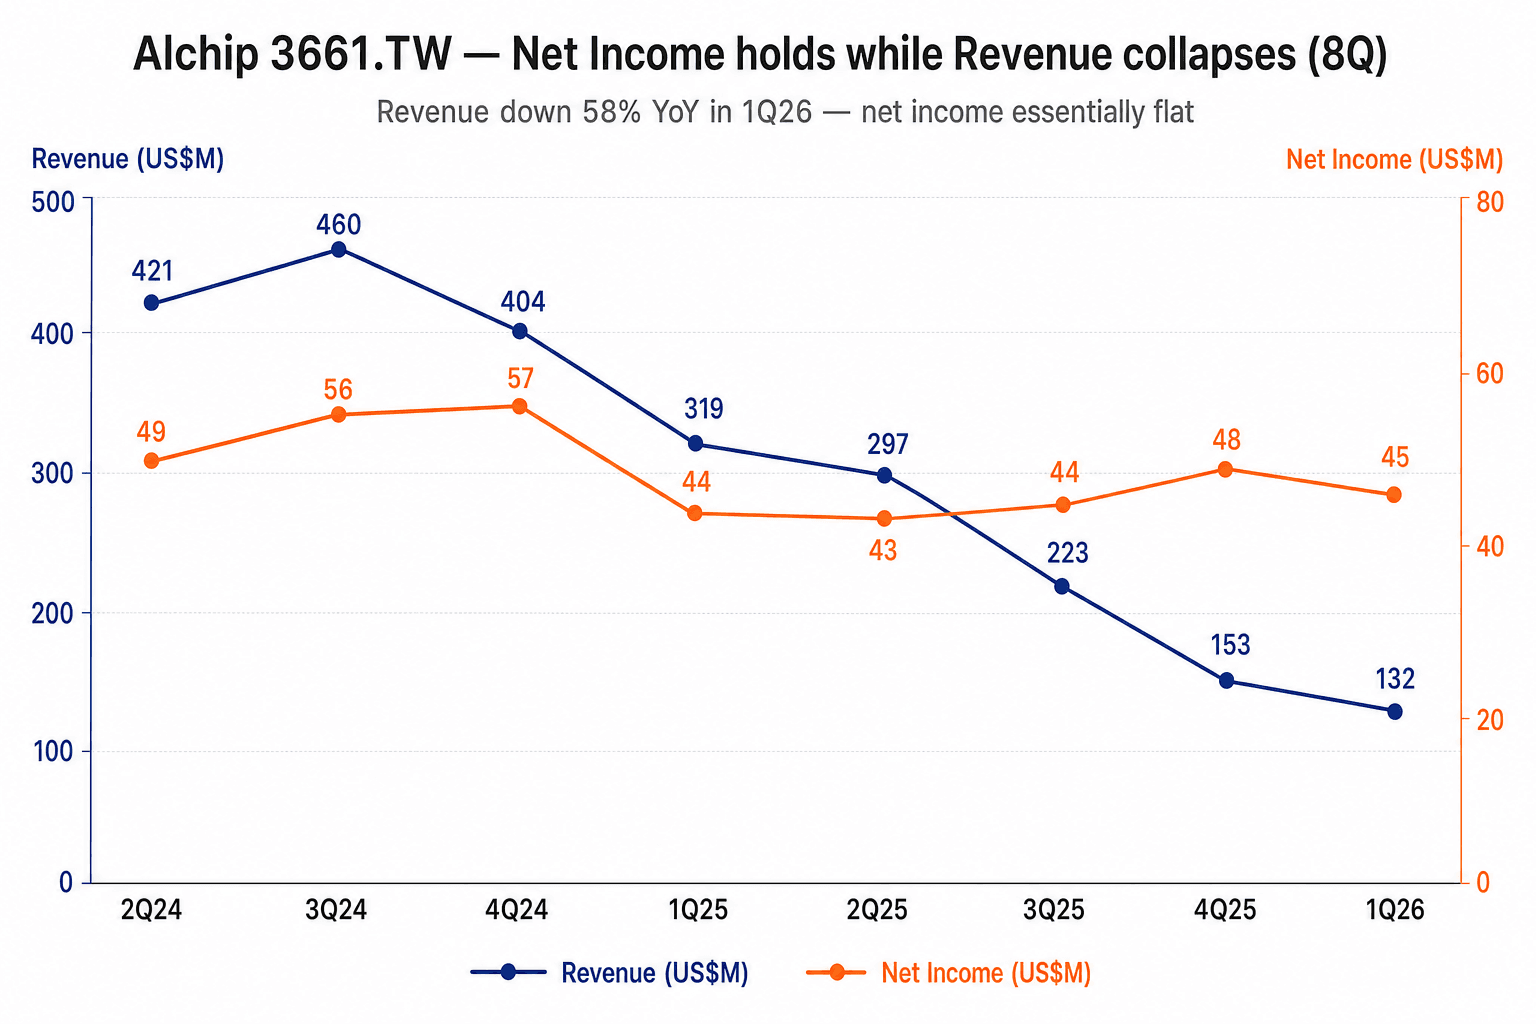
Same eight quarters, two lines:
- Revenue range: US$132M – US$460M (3.5× peak-to-trough)
- Net income range: US$43M – US$57M (1.3× peak-to-trough)
Net income volatility is roughly one-third of revenue volatility — a direct consequence of the structurally higher NRE mix. In Q&A, when asked whether 50% gross margin is the new normal, the CFO said no — when N3 production volume returns, margin compresses back to the 25–30% range. He didn't deny something more important though: net income absolute level could stay flat or move up, because the dollar growth from production volume should outrun the margin step-down.
That "margin down, profit up" possibility is the bull case for the stock from here.
Application mix: HPC/AI back to 70%
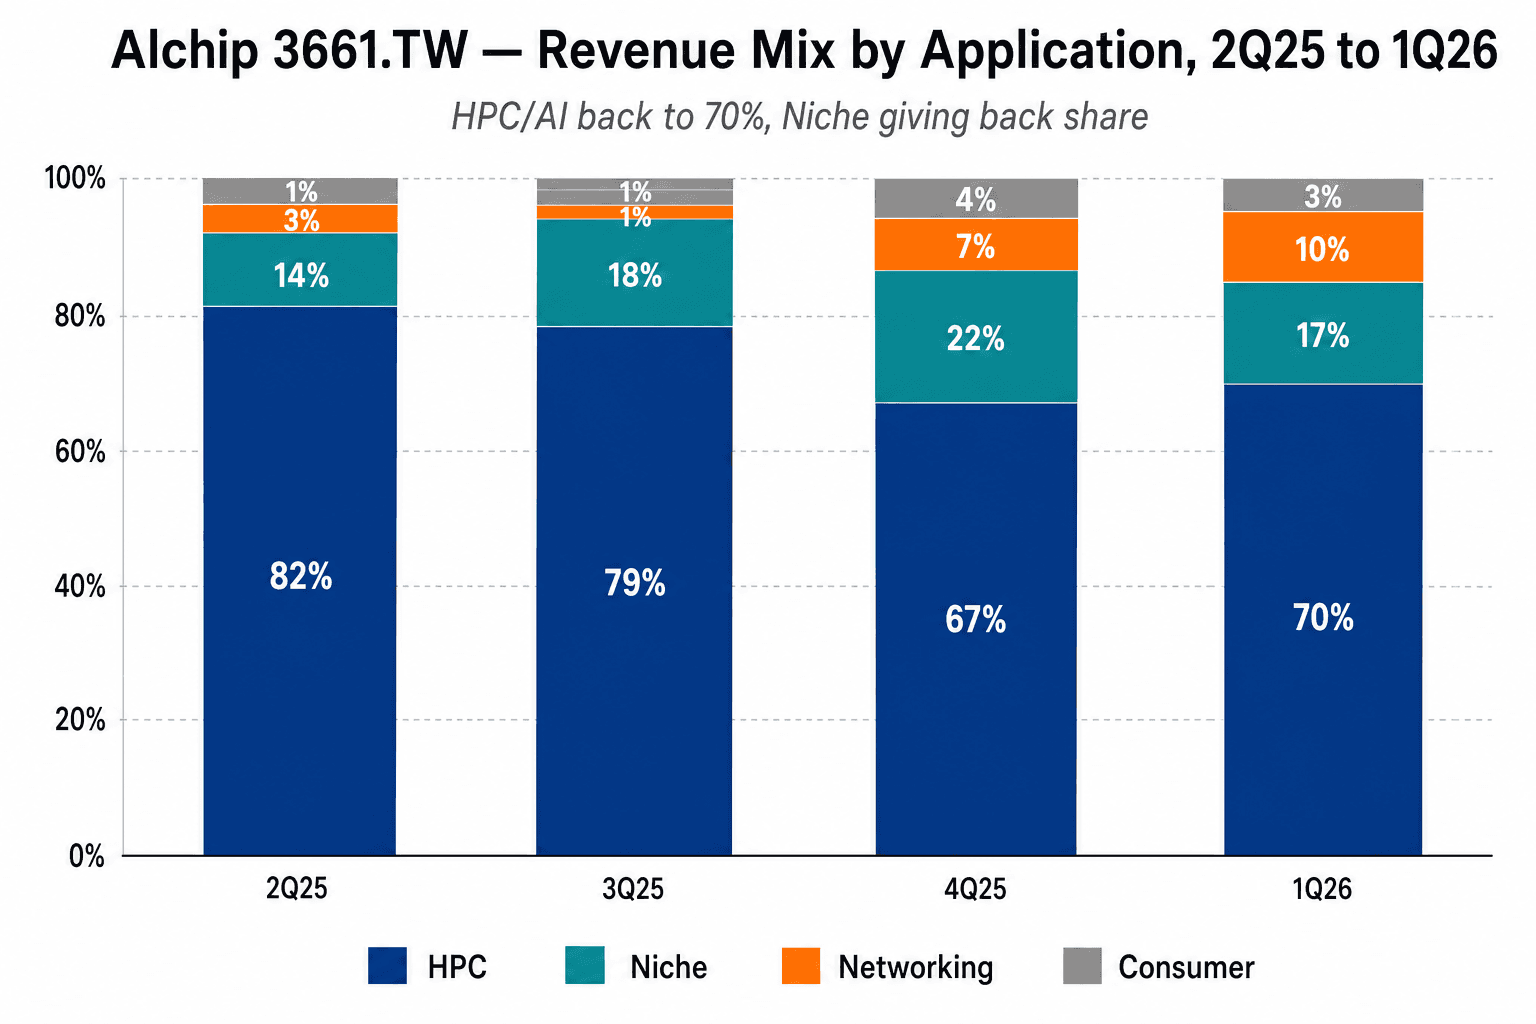
Three things worth tracking:
- HPC/AI back to 70% from 67% in 4Q25. This is still the engine. With the N3 ramp in Q3 reinforcing HPC weight, this 70% is likely the lowest reading we'll see for several quarters.
- Niche fell from 22% to 17% — reverting from its 4Q25 peak. The 22% was a relative-share illusion caused by the AI accelerator dollars walking out; once other segments rebuild, Niche mix-shifts back down.
- Networking went from 1% to 10% — the most underappreciated number on the slide. After a year stuck in 1–3%, a jump to 10% means at least one Networking project recognized meaningful NRE in Q1. It might be the first sign of product-mix diversification, beyond just customer-mix diversification.
Process node mix: 3nm/2nm steady at 9%
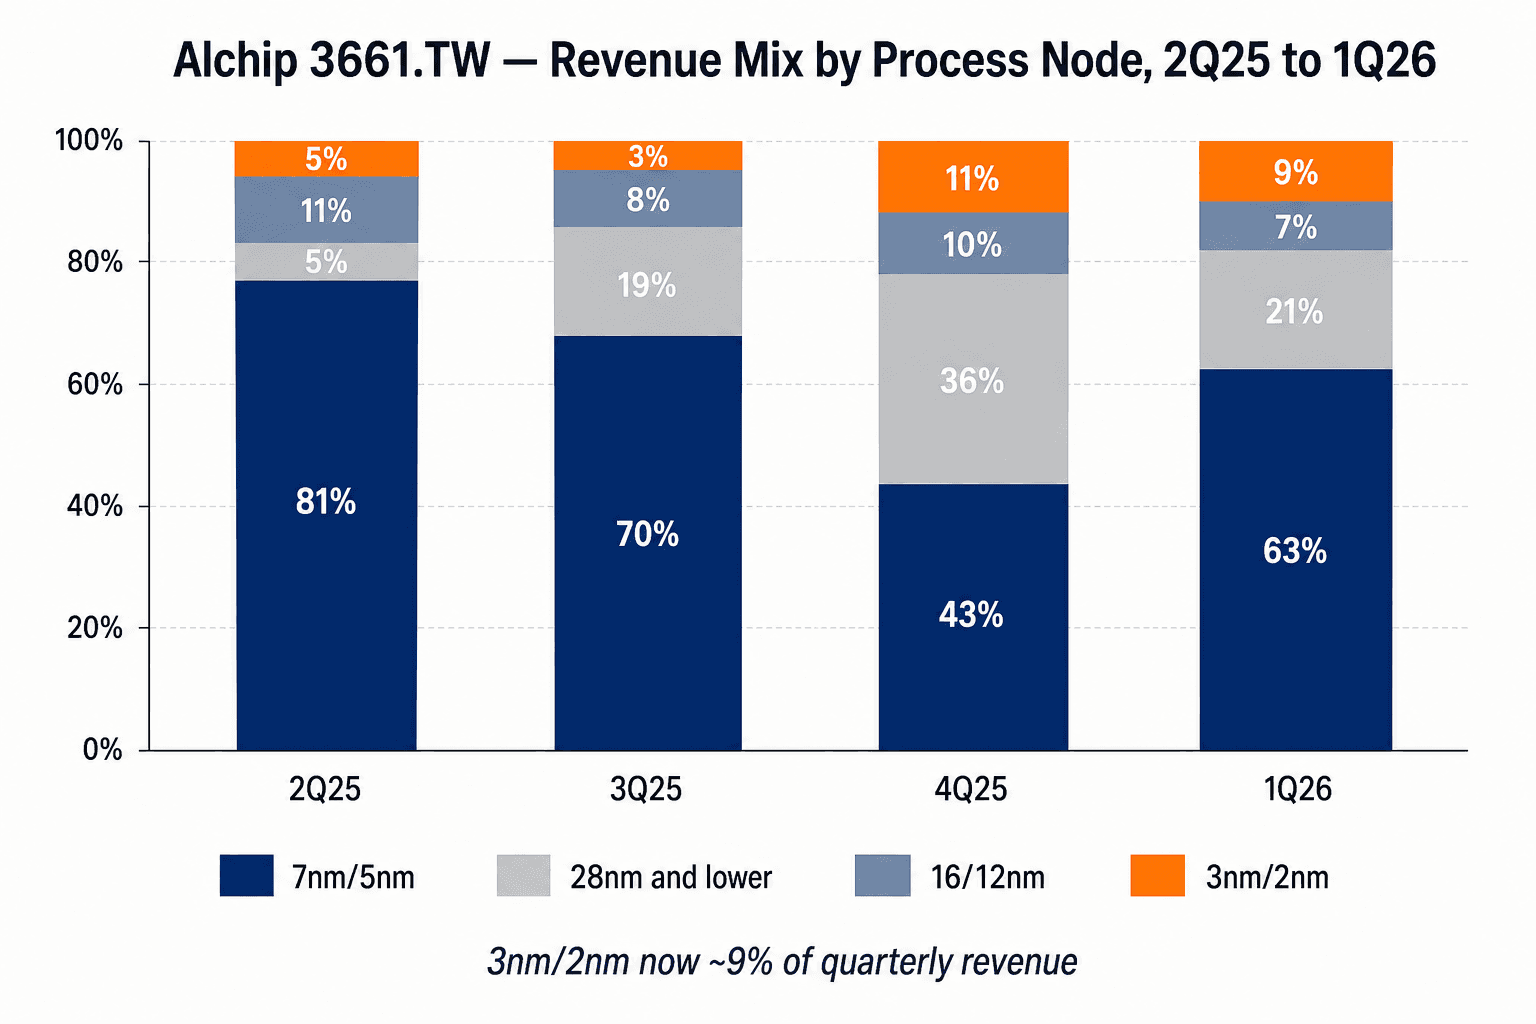
The node mix tells you what the future engine looks like:
- 7nm/5nm at 63% — still the core, but no longer the 94% concentration of 2024. The 31-point drop is the EOL'd 5nm AI accelerator working through.
- 3nm/2nm at 9% — a huge step-up from the 0–1% of a year ago. 9% looks small, but consider: this is mostly NRE (production hasn't started), so 9% of revenue corresponds to a lot of design engineering hours.
- 28nm and lower at 21% — down from the unusual 36% in 4Q25. That 36% was the relative-share illusion again; 21% is closer to what we should expect to see during the ramp-back-up.
2026 is a backend-loaded year — by design
Management's full-year framing is direct: 80% of FY26 revenue lands in H2. Math out: H2 quarterly average needs to be ~US$525M — over 4× the Q1 level of US$132M. The path is one specific story:
As our North American customer's N3 AI accelerator enters massive shipments, we expect very strong sequential revenue and profit growth starting in 3Q26.
— Alchip 1Q26 investor deck, slide 10 (2026-05-08)
The phrase "massive shipments" is worth flagging. The last time Alchip used those exact words was the 2023 Q1 call describing the then-new 5nm AI accelerator ramp. That ramp drove full-year revenue from US$978M (2023) to US$1,618M (2024) — +65% YoY. If this N3 ramp scales similarly, the 2024 peak gets blown through.
But the buy-side is in show-me mode. FactSet consensus Q3 revenue estimates span US$300M–US$450M, and the width of that range is the right signal: ramp magnitude visibility is still poor. The Q2 print (early August) will tighten the band.
N2 is the 2027 story
Management also confirmed a 2027 handoff: the second-generation N2 AI accelerator program is targeting tape-out by year-end 2026. That tape-out itself triggers a meaningful NRE recognition, but more importantly it locks in 2027–2028 NRE design revenue and the eventual Production opportunity beyond.
Customer-wise, Alchip remains hyperscaler-led. The team repeated "multiple hyperscaler programs" in Q&A but won't name names. Industry consensus puts Amazon Trainium as one of them; the N2 second-generation accelerator is plausibly a successor program in the same customer ecosystem.
Why the market isn't bothered by the Q1 miss
Sell-side consensus (14 analysts, 13 Buy / 1 Hold / 0 Sell) was at an average NT$4,460 PT entering the print. The stock at NT$4,890 trades above the average target but below the high (NT$5,380). Post-call we'd expect broad target raises — Yuanta reportedly moved from 4,800 → 5,200, Citi from 5,200 → 5,400 — driven by "50% gross margin resets the FY model."
Reading the print
Q1 2026 is the textbook example of "don't read just one number." Read only the revenue line and you'd think this is a company in decline — -58% YoY is bad on any time horizon. Read only the gross margin line and you'd think this is a structural quality upgrade — 50.2% is the kind of number ASIC service competitors would envy.
Both readings are correct, and they're two faces of the same fact: this is an ASIC design-service business carrying its earnings through a production-cycle gap on the back of NRE. The gap closes when N3 production volume returns in Q3. At that point gross margin compresses from 50% back to 25–30%, but absolute revenue and net income both step up.
The full-year story is already on paper. What's left is one number: the Q3 print. That single quarter decides whether the script gets executed or fumbled.